OCZ Vector (256GB) Review
by Anand Lal Shimpi on November 27, 2012 9:10 PM ESTAnandTech Storage Bench 2011
Two years ago we introduced our AnandTech Storage Bench, a suite of benchmarks that took traces of real OS/application usage and played them back in a repeatable manner. I assembled the traces myself out of frustration with the majority of what we have today in terms of SSD benchmarks.
Although the AnandTech Storage Bench tests did a good job of characterizing SSD performance, they weren't stressful enough. All of the tests performed less than 10GB of reads/writes and typically involved only 4GB of writes specifically. That's not even enough exceed the spare area on most SSDs. Most canned SSD benchmarks don't even come close to writing a single gigabyte of data, but that doesn't mean that simply writing 4GB is acceptable.
Originally I kept the benchmarks short enough that they wouldn't be a burden to run (~30 minutes) but long enough that they were representative of what a power user might do with their system.
Not too long ago I tweeted that I had created what I referred to as the Mother of All SSD Benchmarks (MOASB). Rather than only writing 4GB of data to the drive, this benchmark writes 106.32GB. It's the load you'd put on a drive after nearly two weeks of constant usage. And it takes a *long* time to run.
1) The MOASB, officially called AnandTech Storage Bench 2011 - Heavy Workload, mainly focuses on the times when your I/O activity is the highest. There is a lot of downloading and application installing that happens during the course of this test. My thinking was that it's during application installs, file copies, downloading and multitasking with all of this that you can really notice performance differences between drives.
2) I tried to cover as many bases as possible with the software I incorporated into this test. There's a lot of photo editing in Photoshop, HTML editing in Dreamweaver, web browsing, game playing/level loading (Starcraft II & WoW are both a part of the test) as well as general use stuff (application installing, virus scanning). I included a large amount of email downloading, document creation and editing as well. To top it all off I even use Visual Studio 2008 to build Chromium during the test.
The test has 2,168,893 read operations and 1,783,447 write operations. The IO breakdown is as follows:
| AnandTech Storage Bench 2011 - Heavy Workload IO Breakdown | ||||
| IO Size | % of Total | |||
| 4KB | 28% | |||
| 16KB | 10% | |||
| 32KB | 10% | |||
| 64KB | 4% | |||
Only 42% of all operations are sequential, the rest range from pseudo to fully random (with most falling in the pseudo-random category). Average queue depth is 4.625 IOs, with 59% of operations taking place in an IO queue of 1.
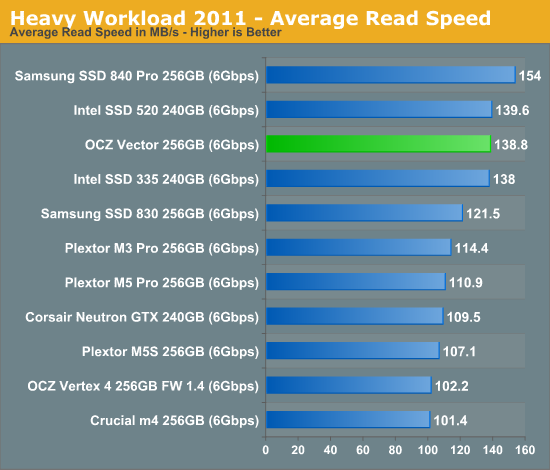
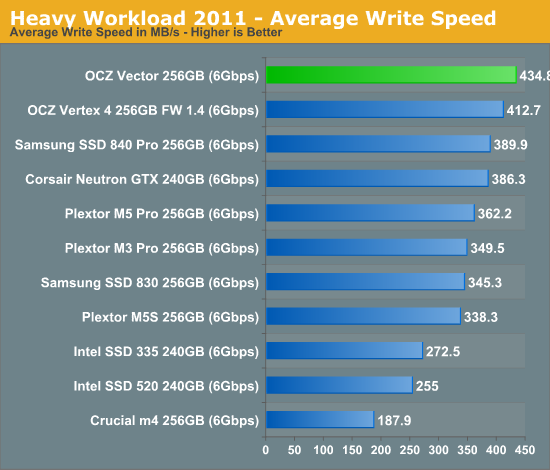
Many of you have asked for a better way to really characterize performance. Simply looking at IOPS doesn't really say much. As a result I'm going to be presenting Storage Bench 2011 data in a slightly different way. We'll have performance represented as Average MB/s, with higher numbers being better. At the same time I'll be reporting how long the SSD was busy while running this test. These disk busy graphs will show you exactly how much time was shaved off by using a faster drive vs. a slower one during the course of this test. Finally, I will also break out performance into reads, writes and combined. The reason I do this is to help balance out the fact that this test is unusually write intensive, which can often hide the benefits of a drive with good read performance.
There's also a new light workload for 2011. This is a far more reasonable, typical every day use case benchmark. Lots of web browsing, photo editing (but with a greater focus on photo consumption), video playback as well as some application installs and gaming. This test isn't nearly as write intensive as the MOASB but it's still multiple times more write intensive than what we were running in 2010.
As always I don't believe that these two benchmarks alone are enough to characterize the performance of a drive, but hopefully along with the rest of our tests they will help provide a better idea.
The testbed for Storage Bench 2011 has changed as well. We're now using a Sandy Bridge platform with full 6Gbps support for these tests.
AnandTech Storage Bench 2011 - Heavy Workload
We'll start out by looking at average data rate throughout our new heavy workload test:
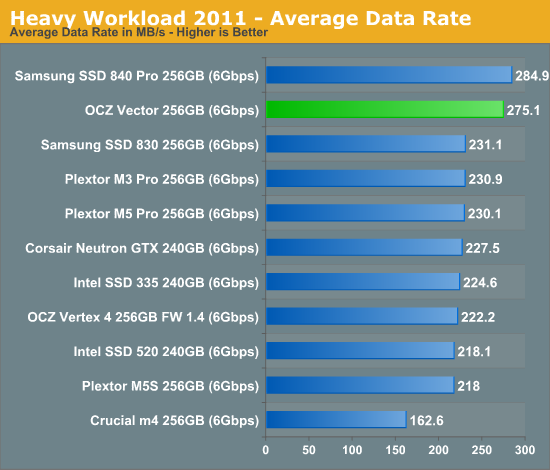
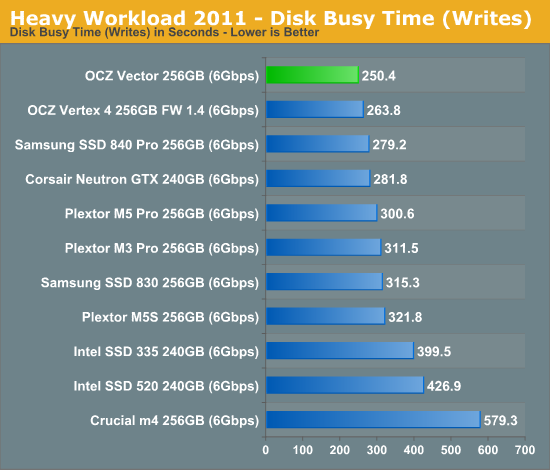
Here it is. OCZ's Vector comes within 4% of Samsung's SSD 840 Pro and manages a 22% increase in performance compared to the Vertex 4. The breakdown shows Vector's strong write performance are really what push it over the edge. At the same time, OCZ has finally addressed whatever poor read performance issues plagued the Vertex 4 in our test - the Vector is a different beast here.
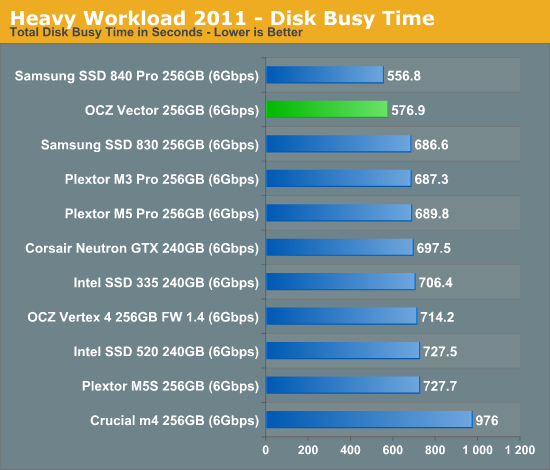
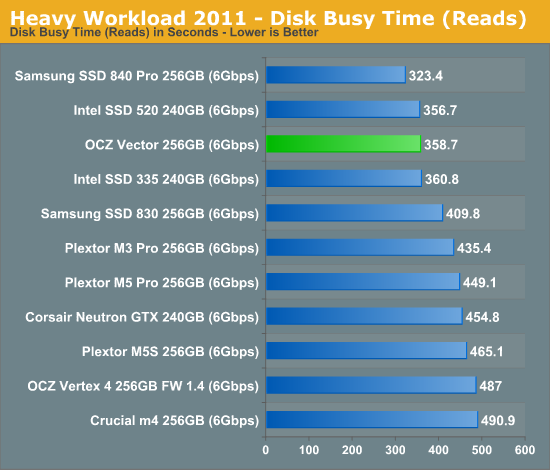
The next three charts just represent the same data, but in a different manner. Instead of looking at average data rate, we're looking at how long the disk was busy for during this entire test. Note that disk busy time excludes any and all idles, this is just how long the SSD was busy doing something:


151 Comments
View All Comments
Brahmzy - Wednesday, November 28, 2012 - link
I should note that this works best after a secure erase and during the Windows install, don't let Windows take up the entire partition. Create a smaller pertition from the get-go. Don't shrink it later in Windows, once the OS has been installed. I believe the SSD controller knows that it can't do it's work in the same way if there is/was an empty partition taking up those cells. I could be wrong - this was the case with the older SSDs - maybe the newer controllers treat any free space as fair game to do their garbage collection/wear leveling.jwilliams4200 - Wednesday, November 28, 2012 - link
If the SSD has a good TRIM implementation, you should be able to reap the same OP benefits (as a secure erase followed by creating a smaller-than-SSD partition) by shrinking a full-SSD partition and then TRIMming the freed LBAs. I don't know for a fact the Windows 7 Disk Management does a TRIM on the freed LBAs after a shrink, but I expect that it does.I tend to use linux more than Windows with SSDs, and when I am doing tests I often use linux hdparm to TRIM whichever sectors I want to TRIM, so I do not have to wonder whether Windows TRIM did I wanted or not. But I agree that the safest way to OP in Windows is to secure erase and then create a partition smaller than the SSD -- then you can be absolutely sure that your SSD has erased LBAs, that are never written to, for the SSD to use as spare area.
seapeople - Sunday, December 2, 2012 - link
Wouldn't it be better if you just paid half price and bought the 60GB drive (or 80GB if you actually *need* 60GB) for the amount of space you needed at the present, and then in a year or two when SSD's are half as expensive, more reliable, and twice as fast you upgrade to the amount of space your needs have grown to?Your new drive without overprovisioning would destroy your old overprovisioned drive in performance, have more space (because we're double the size and not 30% OP'ed), you'd have spent the same amount of money, AND you now have an 80GB drive for free.
Of course, you should never go over 80-90% usage on an SSD anyway, so if that's what you're talking about then never mind...
kozietulski - Wednesday, November 28, 2012 - link
Nice results and great pictures. Really shows importance of free space/OP for random write preformance. Even more amazing is that the results you got seem to fit quite good with simplified model of SSD internal workings:Lets assume we have SDD with only the usual ~7% of OP which was nearly 100% filled (one can say trashed) by purely random 4KB writes (should we now write KiB just to make a few strange guys happy?) and assuming also that the drive operates on 4KB pages and 1MB blocks (today drives seem to be using rather 8KB/2MB but 4KB makes things simpler to think about) so having 256 pages per block. If trashing was good enough to achieve perfect randomisation we can expect that each block contains about 18-19 free pages (out of 256). Under heavy load (QD32, using ncq etc) decent firmware should be able to make use of all that free pages in given block before it (the firmware) decides to write the block back to NAND. Thus under heavy load and with above assumptions ( 7% OP) we can expect at worst case (SSD totaly trashed by random writes and thus free space fully randomized) Wear Amplification of about 256:18 ~= 14:1.
Now when we allow for 20% of free space (in addition to implicit ~7%OP) we should see on average about 71-72 out of 256 pages free in each and every block. This translates to WA ~= 3.6:1 (again assuming that firmware is able to consume all free space in the block before writing it back to nand. That is maybe not so obvious as there are limits in max number of i/o bundled in single ncq request but should not be impossible for the firmware to delay the block write few msecs till next request comes to see if there are more writes to be merged into the block).
Differences in WA translate directly to differences in performance (as long as there is no other bottleneck of course) so with 14:3.6 ~= 3.9 we may expect random 4KB write performance nearly 4 higher for drive with 20% free space compared to drive working with only bare 7% of implicit OP.
May be just an accident but that seem to fit pretty close to results you achieved. :)
jwilliams4200 - Wednesday, November 28, 2012 - link
Interesting analysis. Without knowing exactly how the 840 Pro firmware works I cannot be certain, but it does sound like you have a reasonable explanation for the data I observed.kozietulski - Wednesday, November 28, 2012 - link
Yeah, there is lot of assumptions and simplifications in above... well surely woudn't call it analysis, perhaps hypothesis would be also a bit too much. Modern SSDs have lots of bells and whistles - as well as quirks - and most of them - particularly quirks - aren't documented well. All that means that conformity of the estimation with your results may very well be nothing more then just a coincidence.The one thing I'm reasonably sure however - and it is the reason I thought it is worth to write the post above - is that for random 4K writes on the heavily (ab)used SSD the factor which is limiting performance the most is Write Amplification. (at least as long as we talk about decent SSDs with decent controllers - Phisons does not qualify here I guess :)
In addition to obvious simplifications there was one another shortcut I took above: I based my reasoning on the "perfectly trashed" state of SSD - that is one where SSD's free space is in pages equally spread over all nand blocks. In theory the purpose of GC algos is to prevent drives reaching such a state. Still I think there are workloads which may bring SSDs close enough to that worst possible state and so that it is still meaningful for worst case scenario.
In your case however the starting point was different. AFAIU you used first sequential I/O to fill 100 / 80 % of drive capacity so we can safely assume that before random write session started drive contained about 7% (or ~27% in second case) of clean blocks (with all pages free) and the rest of blocks were completely filled with data with no free pages (thanks to nand-friendly nature of sequential I/O).
Now when random 4K writes start to fly... looking from the LBA space perspective these are by definition overwrites of random chunks of LBA space but from SSD managed perspective at first we have writes filling pool of clean blocks coupled by deletions of randomly selected pages within blocks which were until now fully filled with data. Surely such deletion is actually reduced to just marking of such pages as free in firmware FTL tables (any GC at that moment seem highly unlikely imho).
At last comes the moment when clean blocks pool is exhausted (or when size of clean pool falls below the threshold) which is waking up GC alhorithms to make their sisyphean work. At that moment situation looks like that (assuming that there was no active GC until now and that firmware was capable enough to fill clean blocks fully before writing to NAND): 7% (or 27% in second case) of blocks are fully filled with (random) data whereas 93/73 % of blocks are now pretty much "trashed" - they contain (virtually - just marked in FTL) randomly distributed holes of free pages. Net effect is that - compared to the starting point - free space condensed at first in the pool of clean blocks is now evenly spread (with page granularity) over most of drive nand blocks. I think that state does not look that much different then the state of complete, random trashing I assumed in post above...
From that point onward till the end of random session there is ongoing epic struggle against entropy: on one side stream of incoming 4K writes is punching more free page holes in SSD blocks thus effectively trying to randomize distribution of drive available free space and GC algorithms on the other side are doing their best to reduce the chaos and consolidate free space as much as possible.
As a side note I think it is really a pity that there is so little transparency amongst vendors in terms of comunicating to customers internal workings of their drives. I understand commercial issues and all but depriving users of information they need to efficiently use their ssds leads to lots of confused and sometimes simply disappointed consumers and that is not good - in the long run - for the vendors too. Anyway maybe it is time to think about open source ssd firmware for free community?! ;-)))
ps. Thanks for reference to fio. Looks like very flexible tool, may be also easier to use then iometer. Surely worth to try at least.
cbutters - Wednesday, November 28, 2012 - link
So based on 36TB to end the warranty, basically you can only fill up your 512GB drive 72 times before the warranty expires? That doesn't seem like a whole lot of durability. reinstalling a few large games several times could wear this out pretty quickly... or am I understanding something incorrectly.According to my calculations, assuming a gigabit network connection, running at 125MB per second storing data, that is .12GB per second, 7.3242GB per minute, 439GB per hour, or 10.299TB per day... Assuming this heavy write usage,... that 36 TB could potentially be worn out in as little as 3.5 days using a conservative gigabit network speed as the baseline.
Makaveli - Wednesday, November 28, 2012 - link
I've had an SSD 3 years and it currently has 3TB's of host writes!jimhsu - Wednesday, November 28, 2012 - link
I assume warranties such as this assume an unrealistically high write amplification (e.g. 10x) (to save the SSD maker some skin, probably). Your sequential write example (google "rogue data recorder") most likely has a write amplification very close to 1. Hence, you can probably push much more data (still though the warranty remains conservative).jwilliams4200 - Wednesday, November 28, 2012 - link
Even WA=10 is not enough to account for the 512GB warranty of 36TB. That only comes to about 720 erase cycles if WA=10.I think the problem is that the warrantied write amount should really scale with the capacity of the SSD.
Assuming WA=10, then 128GB @ 3000 erase cycles should allow about 3000 *128GB/10 = 38.4TB. The 256GB should allow 76.8TB. And the 512GB should get 153.6TB.