OCZ Vertex 4 Review (128GB), Firmware 1.4/1.5 Tested
by Kristian Vättö on August 4, 2012 10:00 AM ESTAnandTech Storage Bench 2011
Last year we introduced our AnandTech Storage Bench, a suite of benchmarks that took traces of real OS/application usage and played them back in a repeatable manner. Anand assembled the traces out of frustration with the majority of what we have today in terms of SSD benchmarks.
Although the AnandTech Storage Bench tests did a good job of characterizing SSD performance, they weren't stressful enough. All of the tests performed less than 10GB of reads/writes and typically involved only 4GB of writes specifically. That's not even enough exceed the spare area on most SSDs. Most canned SSD benchmarks don't even come close to writing a single gigabyte of data, but that doesn't mean that simply writing 4GB is acceptable.
Originally we kept the benchmarks short enough that they wouldn't be a burden to run (~30 minutes) but long enough that they were representative of what a power user might do with their system. Later, however, we created what we refer to as the Mother of All SSD Benchmarks (MOASB). Rather than only writing 4GB of data to the drive, this benchmark writes 106.32GB. This represents the load you'd put on a drive after nearly two weeks of constant usage. And it takes a long time to run.
1) The MOASB, officially called AnandTech Storage Bench 2011—Heavy Workload, mainly focuses on the times when your I/O activity is the highest. There is a lot of downloading and application installing that happens during the course of this test. Our thinking was that it's during application installs, file copies, downloading, and multitasking with all of this that you can really notice performance differences between drives.
2) We tried to cover as many bases as possible with the software incorporated into this test. There's a lot of photo editing in Photoshop, HTML editing in Dreamweaver, web browsing, game playing/level loading (Starcraft II and WoW are both a part of the test), as well as general use stuff (application installing, virus scanning). We included a large amount of email downloading, document creation, and editing as well. To top it all off we even use Visual Studio 2008 to build Chromium during the test.
The test has 2,168,893 read operations and 1,783,447 write operations. The IO breakdown is as follows:
| AnandTech Storage Bench 2011—Heavy Workload IO Breakdown | ||||
| IO Size | % of Total | |||
| 4KB | 28% | |||
| 16KB | 10% | |||
| 32KB | 10% | |||
| 64KB | 4% | |||
Only 42% of all operations are sequential; the rest ranges from pseudo to fully random (with most falling in the pseudo-random category). Average queue depth is 4.625 IOs, with 59% of operations taking place in an IO queue of 1.
Many of you have asked for a better way to really characterize performance. Simply looking at IOPS doesn't really say much. As a result we're going to be presenting Storage Bench 2011 data in a slightly different way. We'll have performance represented as Average MB/s, with higher numbers being better. At the same time we'll be reporting how long the SSD was busy while running this test. These disk busy graphs will show you exactly how much time was shaved off by using a faster drive vs. a slower one during the course of this test. Finally, we will also break out performance into reads, writes, and combined. The reason we do this is to help balance out the fact that this test is unusually write intensive, which can often hide the benefits of a drive with good read performance.
There's also a new light workload for 2011. This is a far more reasonable, typical every day use case benchmark. It has lots of web browsing, photo editing (but with a greater focus on photo consumption), video playback, as well as some application installs and gaming. This test isn't nearly as write intensive as the MOASB but it's still multiple times more write intensive than what we were running last year.
We don't believe that these two benchmarks alone are enough to characterize the performance of a drive, but hopefully along with the rest of our tests they will help provide a better idea. The testbed for Storage Bench 2011 has changed as well. We're now using a Sandy Bridge platform with full 6Gbps support for these tests.
AnandTech Storage Bench 2011—Heavy Workload
We'll start out by looking at average data rate throughout our new heavy workload test:
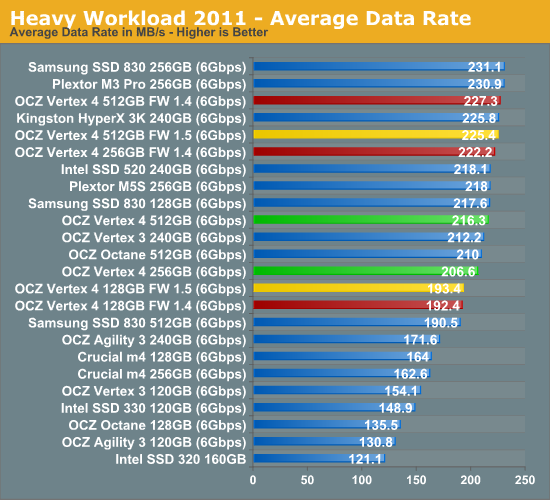
The 1.4 update brought a small boost in our Heavy suite. As you can see in the table above, most IOs are small and the 1.4 and 1.5 firmwares brought marginal improvements to small transfer size performance.
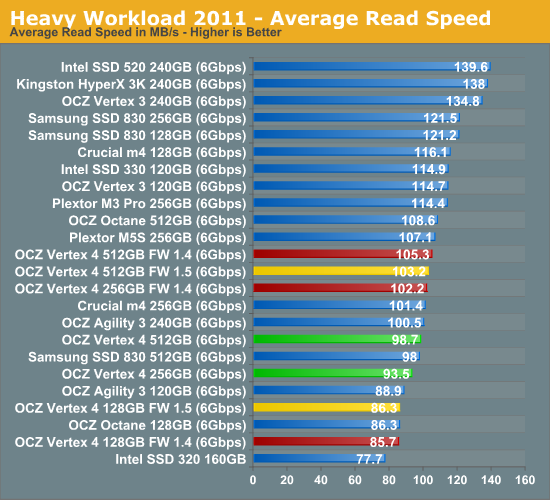
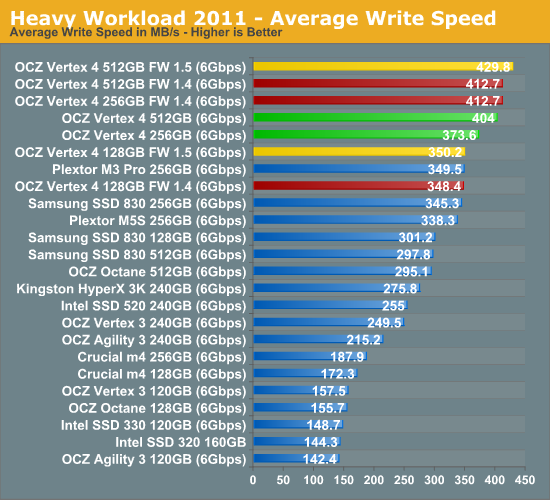
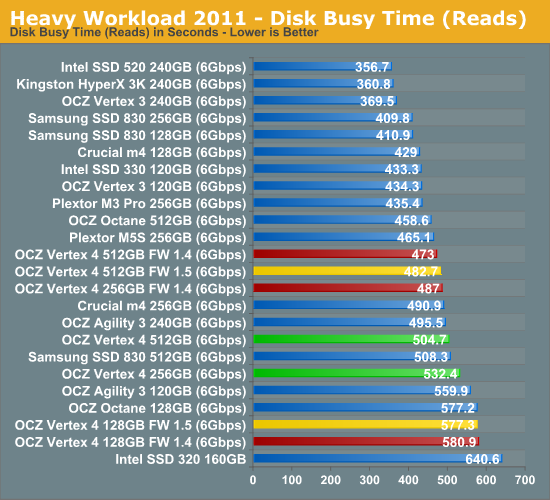
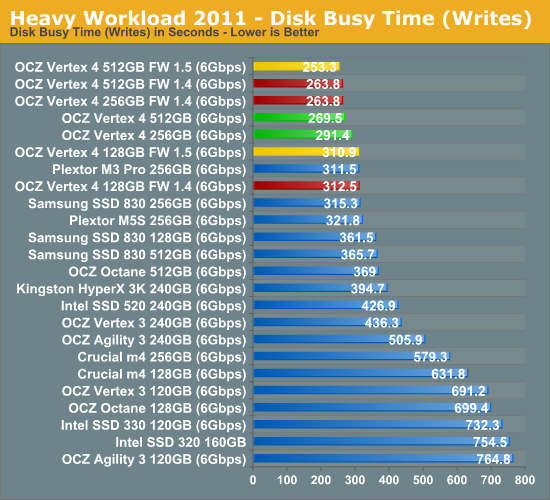
As I mentioned in the previous page, Vertex 4 still lacks read performance at small transfer sizes and the above graphs supports this. The average write performance is very good however and definitely makes up for the middle of the road read performance.
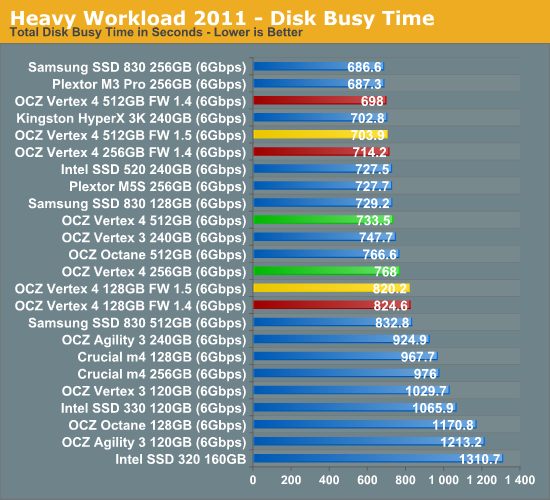
The next three charts just represent the same data, but in a different manner. Instead of looking at average data rate, we're looking at how long the disk was busy for during this entire test. Note that disk busy time excludes any and all idles; this is just how long the SSD was busy doing something:


60 Comments
View All Comments
ewood - Monday, August 6, 2012 - link
You shouldn't feel cheated if you bought the drive thinking read performance was corrected. The increase in read performance does not go away when going from performance mode to storage mode; only write performance in affected. So if you chose to buy the drive when the read performance was corrected you should see those gains regardless of used capacity of the drive. And as a side benefit if less than 50% of the drive is used you also get increased write performance.MadAd - Wednesday, August 8, 2012 - link
the point of a test is to create an environment to repeat runs and compare the differences between them, the fact it wasnt X full or Y empty isnt an issue as long as all drives are treated the same waywe arent concerned if the tests dont reflect what a users drive looks like, users vary, what concerns us is if the tests can be used as a comparison from one drive to another, and we see that they can.
althaz - Saturday, August 4, 2012 - link
I only keep my 240Gb SSD half full. I have Windows, Office, my browser, Broodwar and Starcraft 2 on it and that is pretty much all.I would suggest that most people don't actually put that much stuff on their SSD, unless it is in a laptop.
On a 128Gb drive, though you are more likely to have it at least 3/4 full.
doubledeej - Saturday, August 4, 2012 - link
But most people aren't buying excess capacity they don't intend to use. If you're never going to use more than half of your drive, why waste the extra money (nearly double in many cases) on space that is just going to go to waste?Most people will buy a drive sized appropriately for their needs, and nothing more, when it comes to SSDs. Especially since the prices just keep dropping and performance keeps improving. Buy what you need now, and upgrade later if you need to.
mattlach - Monday, August 6, 2012 - link
Exactly.I use an SSD for my operating system, programs, games and a few files I am currently working on. Everything else gets stored on my NAS.
I opted for a 240GB SSD this time around as my old 120GB Agility was a little tight for this purpose, and I was running out of space.
With my usage model, I will likely not come even close to filling the 256GB drive, but I'll likely go just over the 50% mark, which is why I am concerned.
MrSpadge - Sunday, August 5, 2012 - link
Sure, SSDs are faster when not fully loaded. But paying 2x as much for double capacity, just for this little performance bonus? Not a good value proposition.sequoia464 - Saturday, August 4, 2012 - link
Any chance of filling the 128 model up over 50% and running the tests over again?Most of my drives are more than 50%, it would be nice to know what the final usage speeds will actally be for these drives once they get some of their capacity filled.
mattlach - Sunday, August 5, 2012 - link
I support this fully.It would be good to know what exactly we can expect once the drive goes past the 50% mark.
Also, it has been stated that this is a once time calculation and reorganization of data. Does this mean that if you do a fresh install, or otherwise clear up space, you can never get the performance mode back?
We need answers to all these questions.
Bull Dog - Saturday, August 4, 2012 - link
Did power consumption change at all? I'm always interested in this metric due to the impact it can play on battery life.lbeyak - Saturday, August 4, 2012 - link
Yes, I thought in the previous Vertex 4 articles, it was mentioned that the high idle power usage would be addressed with this firmware update???Would be great to know.