Plextor M3 Pro (256GB) Review
by Kristian Vättö on July 1, 2012 1:45 PM ESTAnandTech Storage Bench 2011
Last year we introduced our AnandTech Storage Bench, a suite of benchmarks that took traces of real OS/application usage and played them back in a repeatable manner. Anand assembled the traces out of frustration with the majority of what we have today in terms of SSD benchmarks.
Although the AnandTech Storage Bench tests did a good job of characterizing SSD performance, they weren't stressful enough. All of the tests performed less than 10GB of reads/writes and typically involved only 4GB of writes specifically. That's not even enough exceed the spare area on most SSDs. Most canned SSD benchmarks don't even come close to writing a single gigabyte of data, but that doesn't mean that simply writing 4GB is acceptable.
Originally we kept the benchmarks short enough that they wouldn't be a burden to run (~30 minutes) but long enough that they were representative of what a power user might do with their system. Later, however, we created what we refer to as the Mother of All SSD Benchmarks (MOASB). Rather than only writing 4GB of data to the drive, this benchmark writes 106.32GB. This represents the load you'd put on a drive after nearly two weeks of constant usage. And it takes a long time to run.
1) The MOASB, officially called AnandTech Storage Bench 2011—Heavy Workload, mainly focuses on the times when your I/O activity is the highest. There is a lot of downloading and application installing that happens during the course of this test. Our thinking was that it's during application installs, file copies, downloading, and multitasking with all of this that you can really notice performance differences between drives.
2) We tried to cover as many bases as possible with the software incorporated into this test. There's a lot of photo editing in Photoshop, HTML editing in Dreamweaver, web browsing, game playing/level loading (Starcraft II and WoW are both a part of the test), as well as general use stuff (application installing, virus scanning). We included a large amount of email downloading, document creation, and editing as well. To top it all off we even use Visual Studio 2008 to build Chromium during the test.
The test has 2,168,893 read operations and 1,783,447 write operations. The IO breakdown is as follows:
| AnandTech Storage Bench 2011—Heavy Workload IO Breakdown | ||||
| IO Size | % of Total | |||
| 4KB | 28% | |||
| 16KB | 10% | |||
| 32KB | 10% | |||
| 64KB | 4% | |||
Only 42% of all operations are sequential; the rest ranges from pseudo to fully random (with most falling in the pseudo-random category). Average queue depth is 4.625 IOs, with 59% of operations taking place in an IO queue of 1.
Many of you have asked for a better way to really characterize performance. Simply looking at IOPS doesn't really say much. As a result we're going to be presenting Storage Bench 2011 data in a slightly different way. We'll have performance represented as Average MB/s, with higher numbers being better. At the same time we'll be reporting how long the SSD was busy while running this test. These disk busy graphs will show you exactly how much time was shaved off by using a faster drive vs. a slower one during the course of this test. Finally, we will also break out performance into reads, writes, and combined. The reason we do this is to help balance out the fact that this test is unusually write intensive, which can often hide the benefits of a drive with good read performance.
There's also a new light workload for 2011. This is a far more reasonable, typical every day use case benchmark. It has lots of web browsing, photo editing (but with a greater focus on photo consumption), video playback, as well as some application installs and gaming. This test isn't nearly as write intensive as the MOASB but it's still multiple times more write intensive than what we were running last year.
We don't believe that these two benchmarks alone are enough to characterize the performance of a drive, but hopefully along with the rest of our tests they will help provide a better idea. The testbed for Storage Bench 2011 has changed as well. We're now using a Sandy Bridge platform with full 6Gbps support for these tests.
AnandTech Storage Bench 2011—Heavy Workload
We'll start out by looking at average data rate throughout our new heavy workload test:
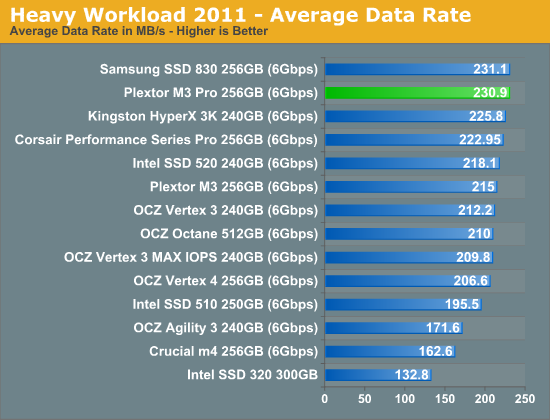
I think it's safe to say that the M3 Pro shares the title of the fastest drive with Samsung SSD 830 in our Heavy suite as the difference between the two is only 0.2MB/s, which is well under the margin of error between runs. When compared with the M3, the M3 Pro is 16MB/s (~7%) faster, which is quite significant when taking into account that these drives share the same hardware. Overall the M3 Pro has outstanding performance for a Marvell based drive and it actually beats all the 240GB SandForce based SSDs we have tested in overall performance for our Heavy scenario.
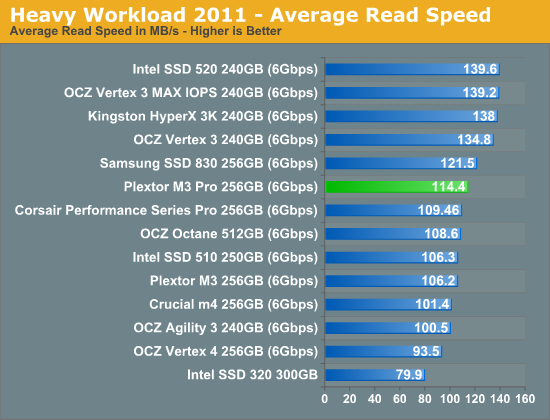
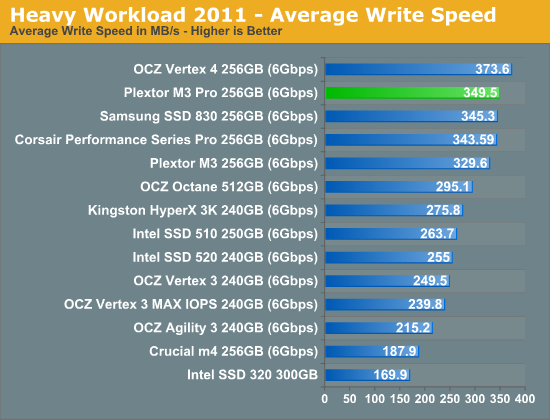
Looking at average read and write speeds, the M3 Pro offers middle-of-the-pack read performance while coming in near the top in read performance--second only to the OCZ Vertex 4. SF-2281 drives go the other route, with typically better read performance but lower write performance (at least with our test data that generally isn't highly compressible).
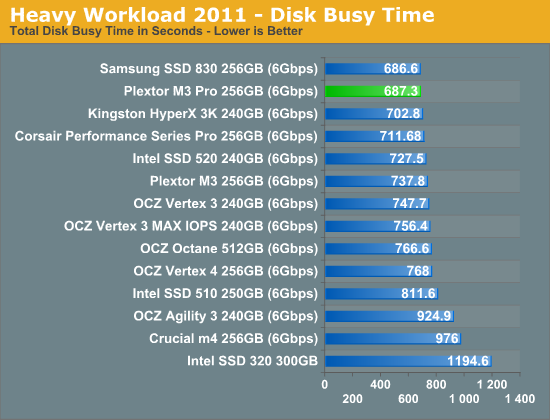
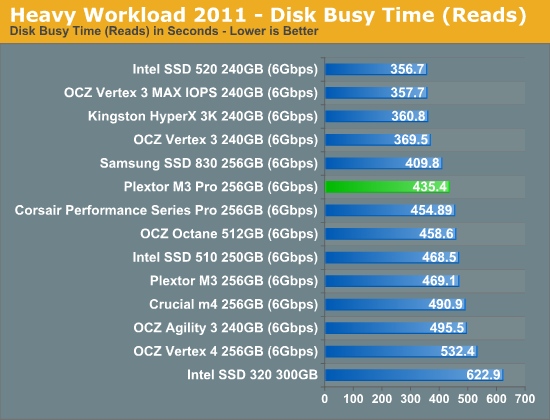
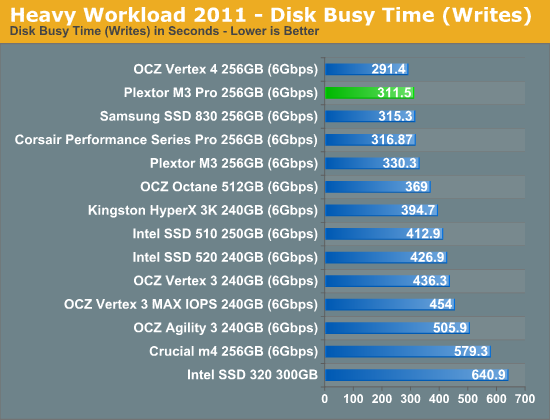
The next three charts just represent the same data, but in a different manner. Instead of looking at average data rate, we're looking at how long the disk was busy for during this entire test. Note that disk busy time excludes any and all idles; this is just how long the SSD was busy doing something:


55 Comments
View All Comments
NCM - Monday, July 2, 2012 - link
Three things I forgot to include in my post above:- The Plextor needs to be reformatted for the Mac. You use Apple's Disk Utility to handle that, as with any other drive.
- Cloning the original drive using DU's Restore function will also automatically clone Lion's hidden Recovery partition.
- Absolute SSD performance is limited by my 2010 MBP's 3 Gb/s SATA interface, so I could have bought a cheaper last generation drive. However I hope to be keeping this pricey SSD long enough for it to see at least one more host computer, and that will support faster transfers.
Belard - Monday, July 2, 2012 - link
Pretty much ALL new SSDs are SATA3.0 / 6GB/s... so its not really an issue.Its older tech or mix tech models that are SATA2.
Kristian Vättö - Monday, July 2, 2012 - link
Not with the regular updater at least. In theory, someone could modify the installer and make it possible though.Kyanzes - Monday, July 2, 2012 - link
"relatively unknown brand" :)Okay.
bobsmith1492 - Monday, July 2, 2012 - link
Yes they are relatively unknown. Yes they used to be more well-known but only for optical drives.eanazag - Monday, July 2, 2012 - link
I would like to see a 2.5" HDD at 5400 rpm and 7200 rpm sample data for a baseline included in the reviews. I don't care if they ever get updated after that. I would just like to be able to quickly see where the mechanical drives chime in.Performance would data would be icing, but power data is nice.
If I upgrade my users to a drive off this list, which is very likely. I'd like to be able to tell them if they are going to take a hit on battery life or a boost.
Belard - Monday, July 2, 2012 - link
They stopped doing that some time ago because it messes up the charts somewhat. Basically, they just don't compare... and that was before the SATA 6Gbps drives came out.Here is a early 2011 review with a WD VelociRaptor (The fastest HD money can buy for a consumer drive). And yet, its a sliver. Only SSDs that perform almost as slow are the bottom end SSD. And keep in mind, the Raptors are 2-3 times faster than a 5400RPM drive.
http://www.anandtech.com/show/4346/ocz-agility-3-2...
RANDOM READ (MB/s)
00.68 = Raptor
58.10 = Intel X25-M G2 (still a very good drive)
93.50 = Crucial C300 (early 6Gbps drives)
Sequential READ (MB/s)
145.30 = Raptor
226.30 = Intel X25-M G2 (still a very good drive)
307.20 = Crucial C300 (early 6Gbps drives)
392.20 = Intel 510 SSD (6Gbps)
A modern high end SSD is about 100x faster in random R / W operations over any HD.
Oh, here is a GOOD older 2010 review which includes a Seagate 5400 RPM 2.5" drive. OUCH!
http://www.anandtech.com/show/3690/the-impact-of-s...
See how the chart becomes somewhat meaningless? And thats with 3Gbps drives!
Imagine looking at a chart comparing a 16mhz 286 to a quad core 3400mhz i5 CPU.
hechacker1 - Monday, July 2, 2012 - link
Probably, assuming there isn't some checksum that can't be cracked to flash the drive.In my experience, almost all drive firmwares can be flashed.
sulu1977 - Monday, July 2, 2012 - link
Speed and performance of such a device is important, but not as important as reliability. Reliability is hands down my top priority. Just wanted to mention this.octoploid - Tuesday, July 3, 2012 - link
There is already an unofficial tool available that can transform a normal M3 into an M3-Pro:http://bbs.pceva.com.cn/thread-47279-1-1.html