The Intel Ivy Bridge (Core i7 3770K) Review
by Anand Lal Shimpi & Ryan Smith on April 23, 2012 12:03 PM EST- Posted in
- CPUs
- Intel
- Ivy Bridge
The Test
It turns out that our initial preview numbers were quite good. The shipping 3770K performs identically to what we tested last month. To keep the review length manageable we're presenting a subset of our results here. For all benchmark results and even more comparisons be sure to use our performance comparison tool: Bench.
| Motherboard: | ASUS P8Z68-V Pro (Intel Z68) ASUS Crosshair V Formula (AMD 990FX) Intel DX79SI (Intel X79) Intel DZ77GA-70K (Intel Z77) |
| Hard Disk: | Intel X25-M SSD (80GB) Crucial RealSSD C300 OCZ Agility 3 (240GB) |
| Memory: | 4 x 4GB G.Skill Ripjaws X DDR3-1600 9-9-9-20 |
| Video Card: | ATI Radeon HD 5870 (Windows 7) AMD Processor Graphics Intel Processor Graphics |
| Video Drivers: | AMD Catalyst 12.3 |
| Desktop Resolution: | 1920 x 1200 |
| OS: | Windows 7 x64 |
General Performance
SYSMark 2007 & 2012
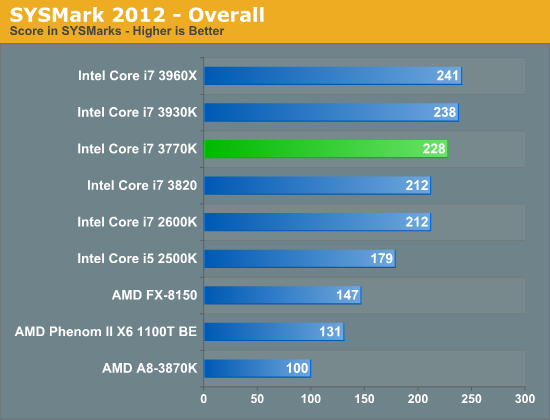
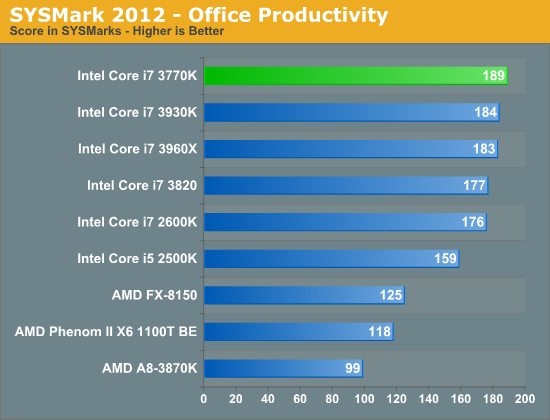
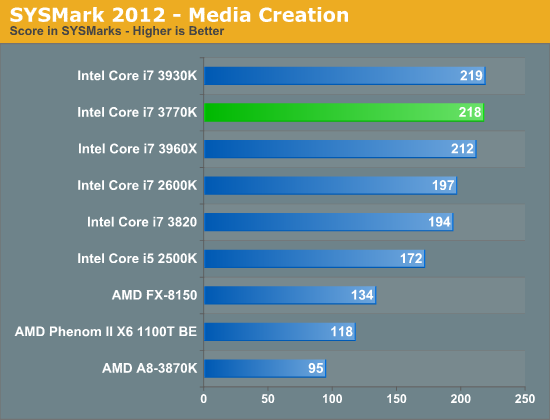
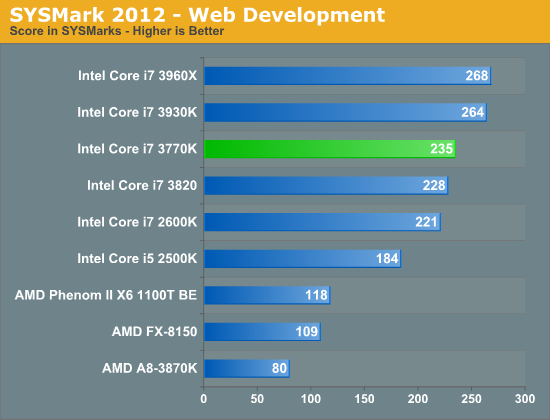
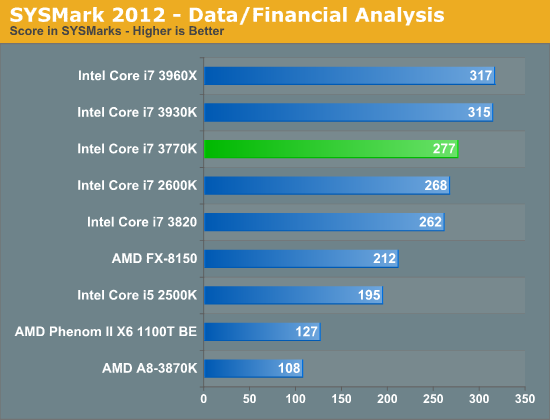
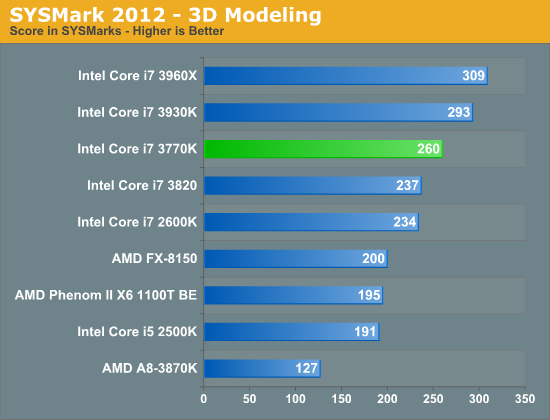
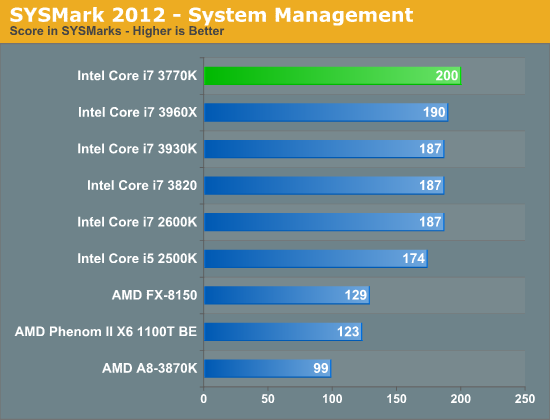
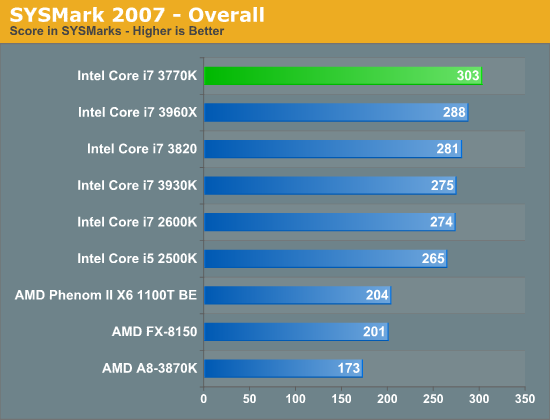
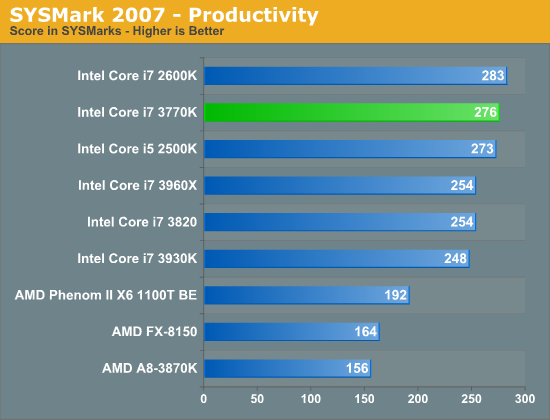
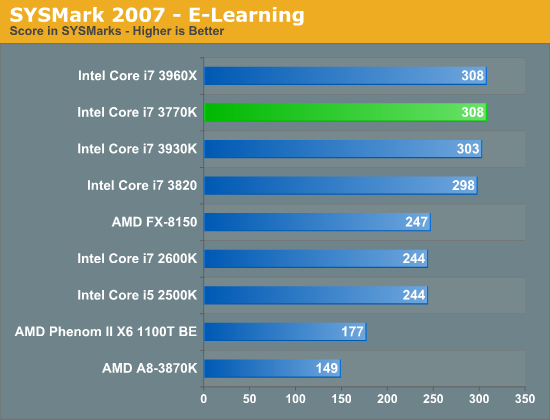
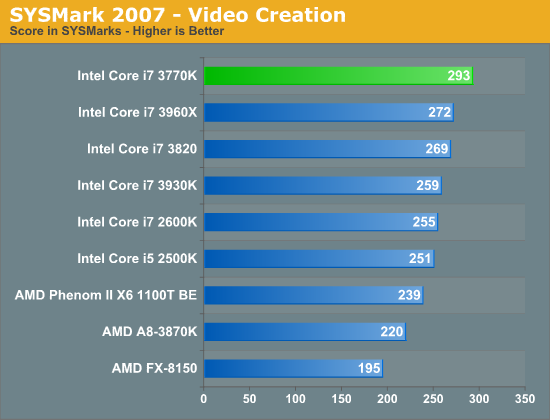
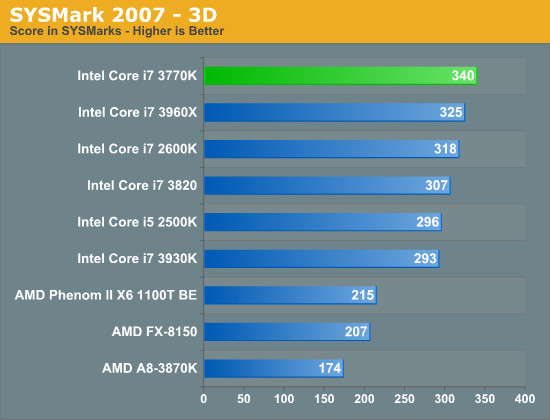
Although not the best indication of overall system performance, the SYSMark suites do give us a good idea of lighter workloads than we're used to testing. SYSMark 2007 is a better indication of low thread count performance, although 2012 isn't tremendously better in that regard.
As the SYSMark suites aren't particularly thread heavy, there's little advantage to the 6-core Sandy Bridge E CPUs. The 3770K however manages to slot in above all of the other Sandy Bridge parts at between 5—20% faster than the 2600K. The biggest advantages show up in either the lightly threaded tests or in the FP heavy benchmarks. Given what we know about Ivy's enhancements, this is exactly what we'd expect.
Content Creation Performance
Adobe Photoshop CS4
To measure performance under Photoshop CS4 we turn to the Retouch Artists’ Speed Test. The test does basic photo editing; there are a couple of color space conversions, many layer creations, color curve adjustment, image and canvas size adjustment, unsharp mask, and finally a gaussian blur performed on the entire image.
The whole process is timed and thanks to the use of Intel's X25-M SSD as our test bed hard drive, performance is far more predictable than back when we used to test on mechanical disks.
Time is reported in seconds and the lower numbers mean better performance. The test is multithreaded and can hit all four cores in a quad-core machine.
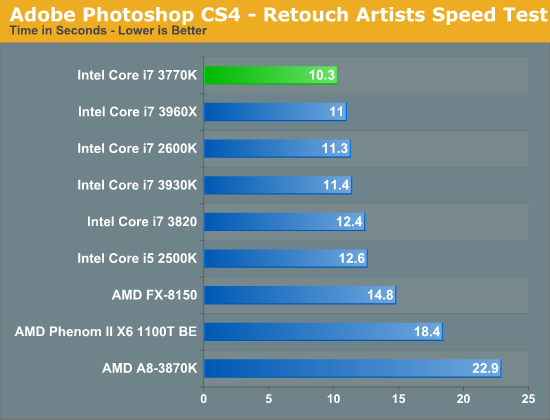
Our Photoshop test is well threaded but it doesn't peg all cores constantly. Instead you get burstier behavior. With the core count advantage out of the way, SNB-E steps aside and allows the 3770K to step up as the fastest CPU we've tested here. The performance advantage over the 2600K is around 9%.
3dsmax 9
Today's desktop processors are more than fast enough to do professional level 3D rendering at home. To look at performance under 3dsmax we ran the SPECapc 3dsmax 8 benchmark (only the CPU rendering tests) under 3dsmax 9 SP1. The results reported are the rendering composite scores.
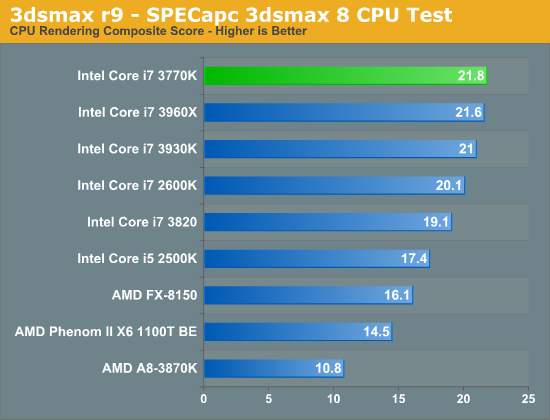
In another FP heavy workload we see a pretty reasonable gain for Ivy Bridge: 8.5% over a 2600K. This isn't enough to make you want to abandon your Sandy Bridge, but it's a good step forward for a tick.
Cinebench 11.5
Created by the Cinema 4D folks we have Cinebench, a popular 3D rendering benchmark that gives us both single and multi-threaded 3D rendering results.
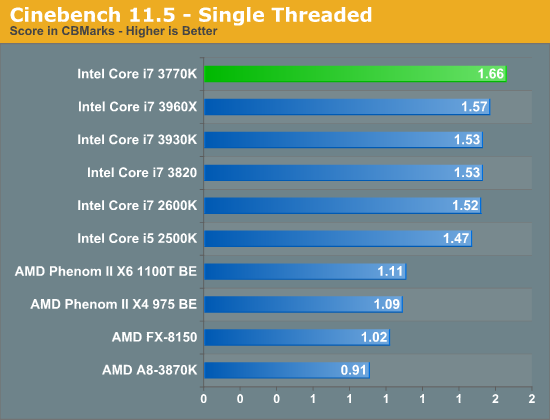
The single threaded Cinebench test shows a 9% performance advantage for the 3770K over the 2600K. The gap increases slightly to 11% as we look at the multithreaded results:
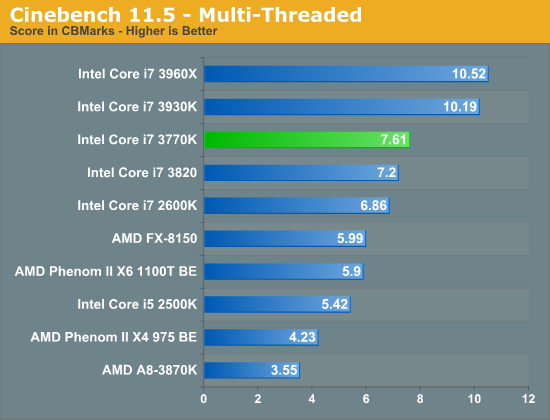
If you're running a workload that can really stress multiple cores, the 6-core Sandy Bridge E parts will remain unstoppable but in the quad-core world, Ivy Bridge leads the pack.
Video Transcoding Performance
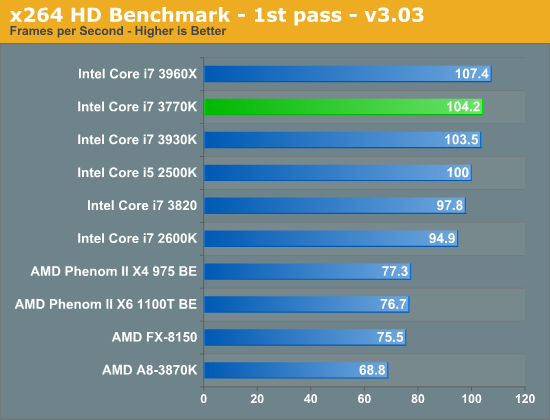
x264 HD 3.03 Benchmark
Graysky's x264 HD test uses x264 to encode a 4Mbps 720p MPEG-2 source. The focus here is on quality rather than speed, thus the benchmark uses a 2-pass encode and reports the average frame rate in each pass.
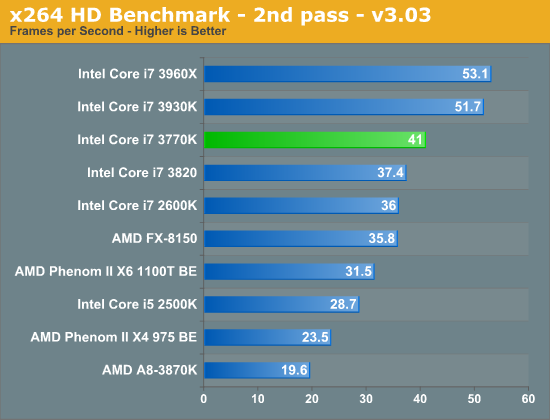
In the second pass of our x264 test we see a nearly 14% increase over the 2600K. Once again, there's no replacement for more cores in these types of workloads but delivering better performance in a lower TDP than last year's quad-core is great for more thermally conscious desktops.
Software Development Performance
Compile Chromium Test
You guys asked for it and finally I have something I feel is a good software build test. Using Visual Studio 2008 I'm compiling Chromium. It's a pretty huge project that takes over forty minutes to compile from the command line on a Core i3 2100. But the results are repeatable and the compile process will stress all 12 threads at 100% for almost the entire time on a 980X so it works for me.
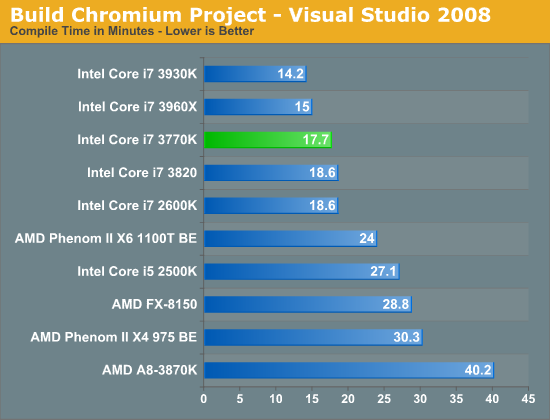
Ivy Bridge shows more traditional gains in our VS2008 benchmark—performance moves forward here by a few percent, but nothing significant. We are seeing a bit of a compressed dynamic range here for this particular compiler workload, it's quite possible that other bottlenecks are beginning to creep in as we get even faster microarchitectures.
Compression & Encryption Performance
7-Zip Benchmark
By working with a small dataset, the 7-zip benchmark gives us an indication of multithreaded integer performance without being IO limited:
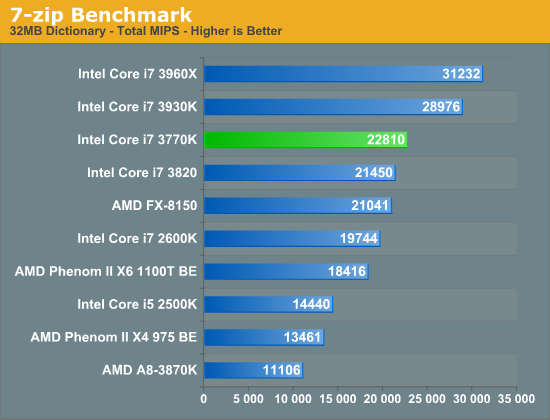
Although real world compression/decompression tests can be heavily influenced by disk IO, the CPU does play a significant role. Here we're showing a 15% increase in performance over the 2600K. In the real world you'd see something much smaller as workloads aren't always so well threaded. The results here do have implications for other heavily compute bound integer workloads however.
TrueCrypt Benchmark
TrueCrypt is a very popular encryption package that offers full AES-NI support. The application also features a built-in encryption benchmark that we can use to measure CPU performance:
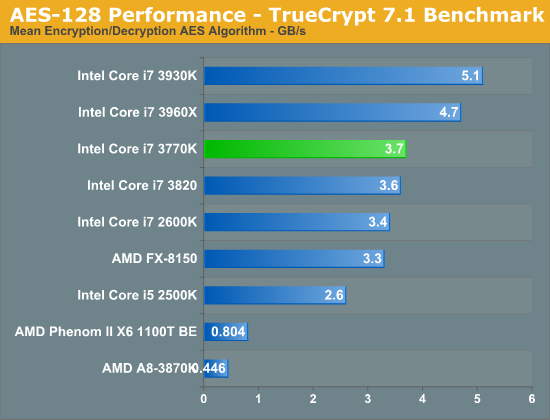
Our TrueCrypt test scales fairly well with clock speed, I suspect what we're seeing here might be due in part to Ivy's ability to maintain higher multi-core turbo frequencies despite having similar max turbo frequencies to Sandy Bridge.


173 Comments
View All Comments
frozentundra123456 - Tuesday, April 24, 2012 - link
On the desktop, you are correct, especially if one overclocks. On the mobile front, IVB is a definite step up on the graphics front. My main reason for the responses to this thread was that it seemed premature for the original poster to imply that this site is being unfair to AMD/Trinity before we even know how much the improvement will be or read a review.iwod - Tuesday, April 24, 2012 - link
I read other press about 22nm 3D transistor as 11 years in the making. 11 years! Did anyone remember a article Anandtech posted a long time ago. It was about 3D transistors and Die Stacking. I did Google and Site search but could not find it. I cant record when was the article written but i was a long time. We have been waiting forever on these tech. We thought we wont see it for another 5 years.... and this is 11 years since then!Bit About Haswell Monster Graphics. Charlie also pointed towards CrystalWell, or a piece of silicon L4 SRAM Cache that is built for Graphics. Could Die Stacking be it, a piece of SRAM Cache on top or under?
I hope we do get more then 300% increase in performance. These way Ultrabook can really do get away with discrete graphics.
Well Ivy Bridge QuickSync wasn't as fast as we first thought. 7 min to transfer to iPad is fast, but what we want is sub 3 min. I.e the time transcode 1080P to portable format should be the same time to transfer 2.5 GB File from a USB 2.0 to iPad. Both Process should be happening in the same time. So when you "transfer" you are literally transcoding on the fly.
JarredWalton - Tuesday, April 24, 2012 - link
I'd say most of the same things to you. If you think the 15% clock speed increase of the CPU in Llano MX chips will somehow magically translate into significantly faster GPU performance, you're dreaming. Best-case it would improve some titles 15%, but of the 15 games I tested I can already tell you that CPU speed won't matter in over half of them--the HD 6620G isn't fast enough to use a more powerful CPU. The 10W TDP difference only matters for CPU performance, not the GPU performance, as the CPU clocks change but the GPU clocks don't.JarredWalton - Tuesday, April 24, 2012 - link
No, I think they're equal because these are the parts that are being sold, and they perform roughly the same. Actually, I think that the laptops most people buy with Llano are actually WORSE than Ivy Bridge's HD 4000, because what most people are buying with Llano is the cheap A6 chips, but that's not what we compared.But let's just say that we add DDR3-1600 memory to Llano, and we test with 8GB RAM. (Again, if you think 8GB actually helps in gaming performance, you don't understand technology.) Let's also say that every single game is CPU limited on Llano for kicks. With an MX chip in our hypothetical laptop, the best Llano would d would be to average 15% faster than HD 4000.
That's meaningless. It's the difference between 35FPS and 40FPS in a game, or 30FPS and 26FPS. Congratulations: you GPU might be 15% faster on average buy your CPU is half the speed. That's not a "win" for AMD.
Here's the facts: What was a gap of 50% with mobile Sandy Bridge vs. mobile Llano is now less than 5% on average. AMD has better drivers, but Intel is closing the gap. Trinity will improve GPU performance, and likely do very little for CPU performance. The end.
Riek - Tuesday, April 24, 2012 - link
Hi Anand & Ryan,Would it be possible to use one type of comparison through the pages?
Currently there are pages 'A8 is xx%faster than IvB' and their are pages ivyB trails A8 performance by .. or something similar.
My assumption is (since english is not my native language):
Trailing by 55% means that a A8 122% faster or vice versa. (e.g. it is is 55%slower than the A8)
Achieving 55% of the A8 means that A8 is 81% faster (e.g. it has 55% of the A8 score. if A8 scores 100, it scores 55).
Would great if the reader knows which one you use an can stick by it instead of having to recalculate it after they read every sentence twice. (and assume the understanding of the sentence is correct). I believe the general use would be part A is x% faster than part B or use the 2600K as a baseline and calculate all others as faster than compared to it.
JarredWalton - Tuesday, April 24, 2012 - link
I'll bet you $100 I can put 8GB RAM in the Llano laptop and it won't change any of the benchmark results by more than 2%. If I swap out the RAM for DDR3-1600, it will potentially increase gaming performance in a few titles by 5-10%, but that's about it.Anand's testing on the desktop showed that DDR3-1600 improved performance on the A8-3850 by around 12-14%, but the A8-3850 also has the 400 cores clocked 35% higher and can thus make better use of additional memory bandwidth. It's similar to DDR3-1866 vs. DDR3-1600 on desktop; the 17% increase in RAM speed only delivers an additional 6%, because the 600MHz HD 6550D cores are the bottleneck at that point. For laptops, the bottleneck is the cores a lot earlier; why do you think so many Llano laptops ship with DDR3-1333 still?
If you'd like to see someone's extensive testing (with a faster A8-3510MX chip even), here's a post that basically confirms everything I've said:
http://forum.notebookreview.com/gaming-software-gr...
BSMonitor - Wednesday, May 2, 2012 - link
Kudos Jarred on the professional way you handled that.Tough to argue with someone who doesn't base their arguments on facts, rather their impression/belief on how things work/perform.
Hrel - Tuesday, April 24, 2012 - link
If I have Ivy Bridge on the desktop, and have my monitor plugged into a dedicated GPU can I still use Quick Sync?Or do I still have to plug the monitor into the motherboard and be using integrated graphics?
Frankly quick sync is useless on the desktop if it doesn't work with a GTX560.
elkatarro - Tuesday, April 24, 2012 - link
Why the hell can't you see that comparing i7 3770K with 3,5 GHz to i7 2600K which runs at 3,4 GHz is POINTLESS?! Pretty much every other site got that point and used 2700K. Sure the 3770K will be faster than 2600K, duh...S20802 - Tuesday, April 24, 2012 - link
32 -> 22 nm, transistor dimension reduced by 31%,75% of die size, 20 % increase in transistor count. This means for the same die size there will be an increase of transistor count by 26%.
Projection
22 -> 14 nm, transistor dimension reduced by 36%.
Applying similar pattern we may get roughly 30% gain in transitor count.
However the gain may be lesser since the gain in IVB could have been due to 3D transistor tech.
So at best 30% and worst around 24% just for the decrease in transistor dimension.
This is by no means a precise calculation taking all factors into consideration.
Assuming the 14nm plant under construction goes online in 2013 with 450mm wafers, we can predict something like below
Transistor Count - nm - Die Size - Wafer Size - Dies/Wafer - Plant Capacity [Wafers/Month] - Plant Efficiency [%] - Yield [%] - Total Plants - Processors/Month
1.4B 22 160 300 441.9642857 50000 75 50 3 24,860,491.07
1.8B 14 160 450 994.4196429 50000 75 50 1 18,645,368.30
A staggering 18 Million working dies per month with 1.8B transistors at 160 mm2, with plant capacity of 50000 wafers/month, plant efficiency 75% and yield 50%, with 1 plant
Lets not forget the partly defective dies will be fused off to become some low end part which means the yield could touch 60%, taking the working dies to 22 Millions per month!!
This means Intel is going to make really cheap processors. 450mm wafer + 14nm = Game changer. Of course the fab is super expensive. But from what came out from Intel those first few batches of chips are paying for the ramp up to 22nm.
For an ultra mobile processor like Atom, in 2014, even a massive redesign of chip would still keep it well under 100 mm2. At 100 mm2, an Atom in 2014 will have ~1B transistors!!! Take that ARM.
My faith in Intel is rekindled. :-). AMD needs to be around to shove Intel whenever it gets too lazy. ARM is now helping AMD too in shoving Intel.