The Crucial m4 SSD Update: Faster with FW0009
by Anand Lal Shimpi on August 31, 2011 12:56 AM ESTAnandTech Storage Bench 2011
Last year we introduced our AnandTech Storage Bench, a suite of benchmarks that took traces of real OS/application usage and played them back in a repeatable manner. I assembled the traces myself out of frustration with the majority of what we have today in terms of SSD benchmarks.
Although the AnandTech Storage Bench tests did a good job of characterizing SSD performance, they weren't stressful enough. All of the tests performed less than 10GB of reads/writes and typically involved only 4GB of writes specifically. That's not even enough exceed the spare area on most SSDs. Most canned SSD benchmarks don't even come close to writing a single gigabyte of data, but that doesn't mean that simply writing 4GB is acceptable.
Originally I kept the benchmarks short enough that they wouldn't be a burden to run (~30 minutes) but long enough that they were representative of what a power user might do with their system.
Not too long ago I tweeted that I had created what I referred to as the Mother of All SSD Benchmarks (MOASB). Rather than only writing 4GB of data to the drive, this benchmark writes 106.32GB. It's the load you'd put on a drive after nearly two weeks of constant usage. And it takes a *long* time to run.
1) The MOASB, officially called AnandTech Storage Bench 2011 - Heavy Workload, mainly focuses on the times when your I/O activity is the highest. There is a lot of downloading and application installing that happens during the course of this test. My thinking was that it's during application installs, file copies, downloading and multitasking with all of this that you can really notice performance differences between drives.
2) I tried to cover as many bases as possible with the software I incorporated into this test. There's a lot of photo editing in Photoshop, HTML editing in Dreamweaver, web browsing, game playing/level loading (Starcraft II & WoW are both a part of the test) as well as general use stuff (application installing, virus scanning). I included a large amount of email downloading, document creation and editing as well. To top it all off I even use Visual Studio 2008 to build Chromium during the test.
The test has 2,168,893 read operations and 1,783,447 write operations. The IO breakdown is as follows:
| AnandTech Storage Bench 2011 - Heavy Workload IO Breakdown | ||||
| IO Size | % of Total | |||
| 4KB | 28% | |||
| 16KB | 10% | |||
| 32KB | 10% | |||
| 64KB | 4% | |||
Only 42% of all operations are sequential, the rest range from pseudo to fully random (with most falling in the pseudo-random category). Average queue depth is 4.625 IOs, with 59% of operations taking place in an IO queue of 1.
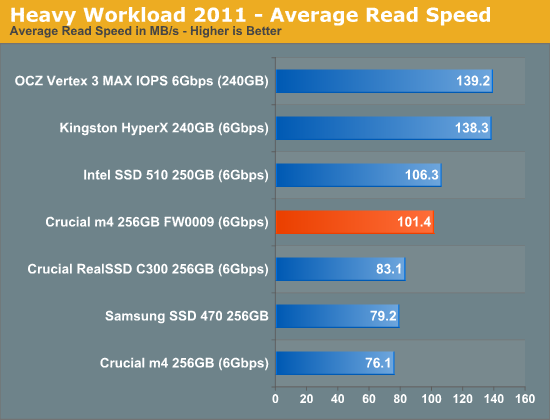
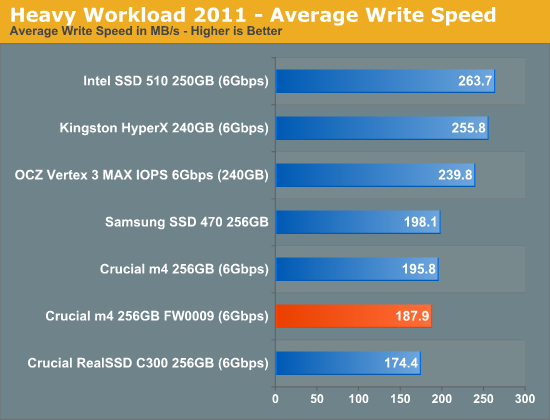
Many of you have asked for a better way to really characterize performance. Simply looking at IOPS doesn't really say much. As a result I'm going to be presenting Storage Bench 2011 data in a slightly different way. We'll have performance represented as Average MB/s, with higher numbers being better. At the same time I'll be reporting how long the SSD was busy while running this test. These disk busy graphs will show you exactly how much time was shaved off by using a faster drive vs. a slower one during the course of this test. Finally, I will also break out performance into reads, writes and combined. The reason I do this is to help balance out the fact that this test is unusually write intensive, which can often hide the benefits of a drive with good read performance.
There's also a new light workload for 2011. This is a far more reasonable, typical every day use case benchmark. Lots of web browsing, photo editing (but with a greater focus on photo consumption), video playback as well as some application installs and gaming. This test isn't nearly as write intensive as the MOASB but it's still multiple times more write intensive than what we were running last year.
As always I don't believe that these two benchmarks alone are enough to characterize the performance of a drive, but hopefully along with the rest of our tests they will help provide a better idea.
The testbed for Storage Bench 2011 has changed as well. We're now using a Sandy Bridge platform with full 6Gbps support for these tests.
AnandTech Storage Bench 2011 - Heavy Workload
We'll start out by looking at average data rate throughout our new heavy workload test:
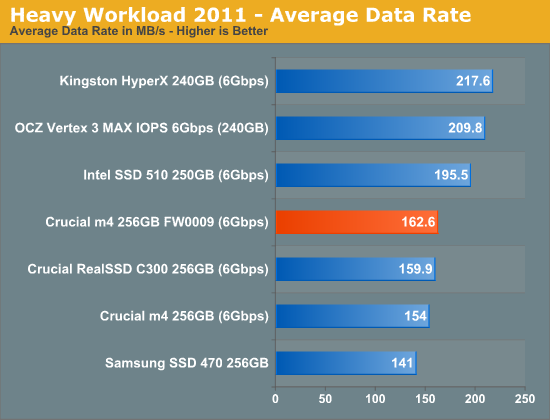
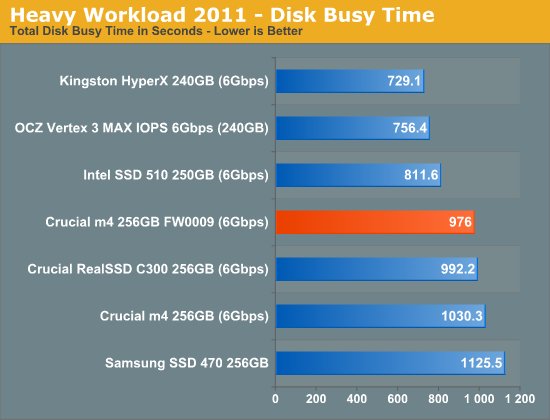
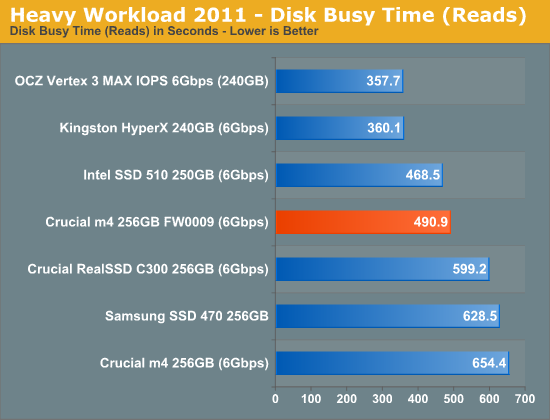
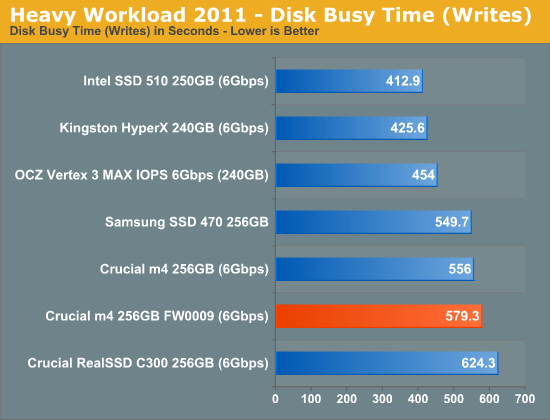
Overall performance in our heavy workload is now on par with last year's C300. We don't see huge gains in our heavy suite but Crucial has never really done well here to begin with. At least the numbers are up above the C300. The SF-2281 based Kingston HyperX has a 33% performance advantage here but if you look at the disk busy time below that amounts to around 4 minutes saved over hours of execution. In other words, you'd be hard pressed to tell the difference between nearly any of these drives.
The next three charts just represent the same data, but in a different manner. Instead of looking at average data rate, we're looking at how long the disk was busy for during this entire test. Note that disk busy time excludes any and all idles, this is just how long the SSD was busy doing something:


45 Comments
View All Comments
Nakecat - Wednesday, August 31, 2011 - link
so if TRIM won't work in RAID, it's still ok to run in RAID with ssd built-in GC?I have 4 C300 256GB and thinking either going for RAID 0 or RAID 5.
jwilliams4200 - Wednesday, August 31, 2011 - link
It is NOT true that the Sandforce GC is notably better than the Crucial/Marvell GC.Anand has a terrible method of trying to measure the GC effectiveness. Running HD Tach is just an absurd way to look at how GC performs under realistic work loads. It is almost impossible to name a realistic workload that does large sequential writes OF A STREAM OF ZEROS across the entire span of the SSD. The Sandforce drives just compress the stream of zeros by a factor of about 10, and therefore need to write only about 10% as much data to flash as the Crucial/Marvell, thus making it look like the performance with Sandforce does not degrade much. But if you wrote the same workload to the SSD with incompressible data, the Sandforce GC performs similarly to the Crucial/Marvell GC.
This problem with Anand's testing has been pointed out to him before, but he continues to print misleading information.
Anyone who is interested in looking at sustained performance of SSDs without TRIM should look at the industry standard test protocols as defined in the SNIA documents for "Solid State Storage (SSS) Performance Test Specification (PTS)"
http://www.snia.org/tech_activities/standards/curr...
In particular, the is a pre-conditioning test that specifies using random data and 4KB random writes to get the drive into a steady-state condition. By measuring IOPS vs time while doing 4KB random writes, it is possible to observe the degradation in performance. Then after the drive reaches steady-state, more extensive tests are run to determine sustained performance. This is the sort of testing that Anand should be doing.
MarcHFR - Thursday, September 1, 2011 - link
I agree that using HD Tach is not a very good for such a thing on SandForce SSD.You can also note that HD Tach doesn't wrote so much data on the drive, even a "long" run is ratter quick.
Using IOMETER with incompressible data i get a onther story :
http://www.behardware.com/articles/830-13/tenue-pe...
aferox - Wednesday, August 31, 2011 - link
I've been running two C300 drives for about a year, and an m4 for about two months. Absolutely no problems in that time. Given that these drives were substantially (!) cheaper than the alternatives, and available in large capacities (total of 1TB) I've got to consider them excellent purchases. I'm definitely willing to give up a little speed for reliable and less expensive drives.danjw - Wednesday, August 31, 2011 - link
Why do you let us know that the some of the others are attached to a 6Gbps port, but not some. This chart and review are not useful, unless you provide that data. This seems like a no brainier. Are you purposely handicapping the drives that aren't attached to 6Gbps ports? What is the motivation for this?MrSpadge - Wednesday, August 31, 2011 - link
Considering it's called "Vertex 3 MAX IOPS 6Gbps (240GB)" it looks like a simply typo and was meant to be "Vertex 3 MAX IOPS 240GB (6Gbps)"... which is supported by the fact that the Vertex 3 pushes > 500 MB/s in the article, which would be impossible using SATA-2. The Samsung doesn't support SATA-3. Chill, mate.LTG - Wednesday, August 31, 2011 - link
On OSX (Mac) how much of a performance penalty do we pay over time for not having trim?You mentioned this may be an issue in a previous article...
LTG - Wednesday, August 31, 2011 - link
Ugh, sorry I saw you addressed that - thanks.ChristophWeber - Wednesday, August 31, 2011 - link
On my Intel X25M G2 practically none. There is a TRIM enabler tool for MacOSX floating around, ask Google.gramboh - Wednesday, August 31, 2011 - link
The 256gb M4 is still $439.99 at my local retailer/etailer, and $399.99 at newegg.ca - hopefully the price comes down a bit to match what it is going for in the U.S., because it is an excellent value compared to the 510 at those prices.