The SandForce Roundup: Corsair, Kingston, Patriot, OCZ, OWC & MemoRight SSDs Compared
by Anand Lal Shimpi on August 11, 2011 12:01 AM ESTAnandTech Storage Bench 2011
Last year we introduced our AnandTech Storage Bench, a suite of benchmarks that took traces of real OS/application usage and played them back in a repeatable manner. I assembled the traces myself out of frustration with the majority of what we have today in terms of SSD benchmarks.
Although the AnandTech Storage Bench tests did a good job of characterizing SSD performance, they weren't stressful enough. All of the tests performed less than 10GB of reads/writes and typically involved only 4GB of writes specifically. That's not even enough exceed the spare area on most SSDs. Most canned SSD benchmarks don't even come close to writing a single gigabyte of data, but that doesn't mean that simply writing 4GB is acceptable.
Originally I kept the benchmarks short enough that they wouldn't be a burden to run (~30 minutes) but long enough that they were representative of what a power user might do with their system.
Not too long ago I tweeted that I had created what I referred to as the Mother of All SSD Benchmarks (MOASB). Rather than only writing 4GB of data to the drive, this benchmark writes 106.32GB. It's the load you'd put on a drive after nearly two weeks of constant usage. And it takes a *long* time to run.
1) The MOASB, officially called AnandTech Storage Bench 2011 - Heavy Workload, mainly focuses on the times when your I/O activity is the highest. There is a lot of downloading and application installing that happens during the course of this test. My thinking was that it's during application installs, file copies, downloading and multitasking with all of this that you can really notice performance differences between drives.
2) I tried to cover as many bases as possible with the software I incorporated into this test. There's a lot of photo editing in Photoshop, HTML editing in Dreamweaver, web browsing, game playing/level loading (Starcraft II & WoW are both a part of the test) as well as general use stuff (application installing, virus scanning). I included a large amount of email downloading, document creation and editing as well. To top it all off I even use Visual Studio 2008 to build Chromium during the test.
The test has 2,168,893 read operations and 1,783,447 write operations. The IO breakdown is as follows:
| AnandTech Storage Bench 2011 - Heavy Workload IO Breakdown | ||||
| IO Size | % of Total | |||
| 4KB | 28% | |||
| 16KB | 10% | |||
| 32KB | 10% | |||
| 64KB | 4% | |||
Only 42% of all operations are sequential, the rest range from pseudo to fully random (with most falling in the pseudo-random category). Average queue depth is 4.625 IOs, with 59% of operations taking place in an IO queue of 1.
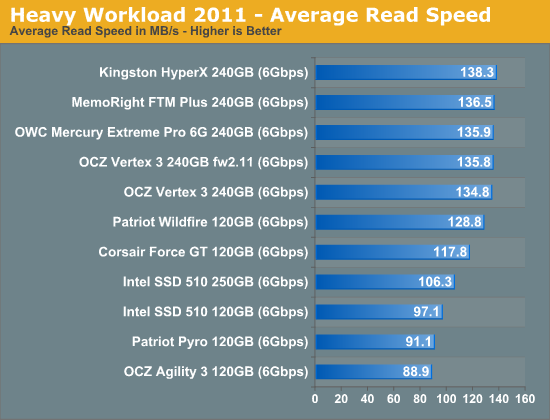
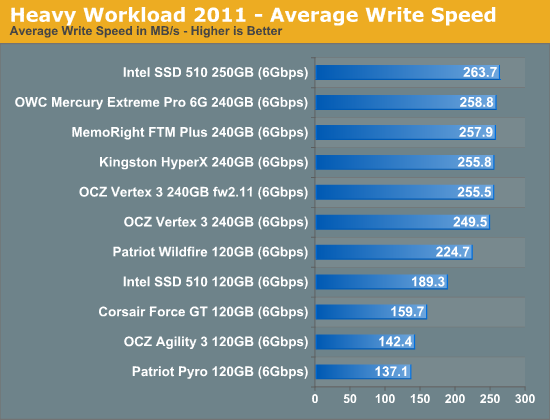
Many of you have asked for a better way to really characterize performance. Simply looking at IOPS doesn't really say much. As a result I'm going to be presenting Storage Bench 2011 data in a slightly different way. We'll have performance represented as Average MB/s, with higher numbers being better. At the same time I'll be reporting how long the SSD was busy while running this test. These disk busy graphs will show you exactly how much time was shaved off by using a faster drive vs. a slower one during the course of this test. Finally, I will also break out performance into reads, writes and combined. The reason I do this is to help balance out the fact that this test is unusually write intensive, which can often hide the benefits of a drive with good read performance.
There's also a new light workload for 2011. This is a far more reasonable, typical every day use case benchmark. Lots of web browsing, photo editing (but with a greater focus on photo consumption), video playback as well as some application installs and gaming. This test isn't nearly as write intensive as the MOASB but it's still multiple times more write intensive than what we were running last year.
As always I don't believe that these two benchmarks alone are enough to characterize the performance of a drive, but hopefully along with the rest of our tests they will help provide a better idea.
The testbed for Storage Bench 2011 has changed as well. We're now using a Sandy Bridge platform with full 6Gbps support for these tests. All of the older tests are still run on our X58 platform.
AnandTech Storage Bench 2011 - Heavy Workload
We'll start out by looking at average data rate throughout our new heavy workload test:
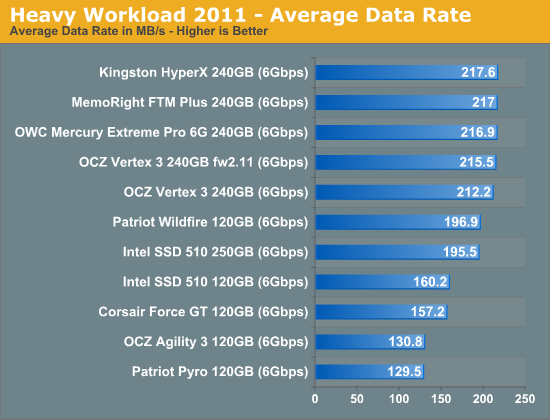
Our Storage Bench suite groups performers according to die count/drive capacity. The 240GB drives are faster than the 120GB counterparts. There's also not much of a difference between the drives with synchronous vs. asynchronous NAND.
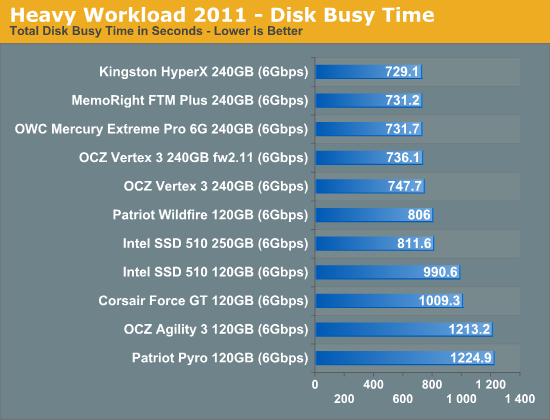
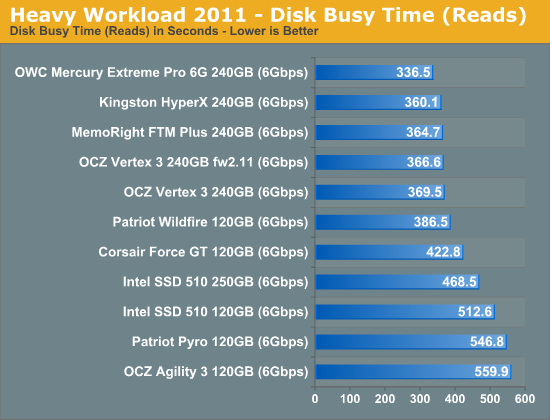
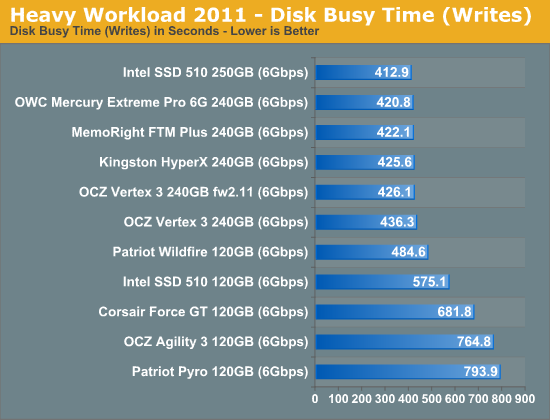
The next three charts just represent the same data, but in a different manner. Instead of looking at average data rate, we're looking at how long the disk was busy for during this entire test. Note that disk busy time excludes any and all idles, this is just how long the SSD was busy doing something:


90 Comments
View All Comments
imaheadcase - Thursday, August 11, 2011 - link
I was wondering the same thing...this seems to happen a lot lately with roundups.Anand Lal Shimpi - Thursday, August 11, 2011 - link
My apologies! An older version of the graphs made its way live, I've updated all of the charts :)Take care,
Anand
Nickel020 - Thursday, August 11, 2011 - link
I always thought the difference in price between a 25nm SF1200 drive and a synchronous SF2200 was mainly due to the cost of the controller, but since you put the controller at $25, it's the NAND in the SF1200 that must be cheaper.A Corsair F115 with synchronous 25nm (G08CAMDB)* costs $170, a Force 3 with asynchronous NAND costs $185 and a Force GT with synchronous NAND costs $245. The synchronous NAND in the F115 must be way cheaper than the synchronous in the Force GT thus.
I'm guessing the SF2200 is more expensive than the SF1200, so that basically means that following your cost breakdown, the asynchronous NAND in drives such as the Force 3 or Agility 3 must be similarly priced as the synchronous NAND in the 25nm SF1200 drives.
Why is the synchronous in the SF1200 drives so much cheaper than the one in the SF1200 drives? Could you decipher the the whole part number?
*I'm assuming the F115 uses the same NAND as the first Vertex 2s with 25nm:
http://www.tomshardware.de/ocz-vertex-2-25nm-ssd,t...
Coup27 - Thursday, August 11, 2011 - link
If the current state of affairs are due to the reasons you have outlined in the first couple of paragraphs then this has been brought on by the manufacturers themselves.All the manufacturers have tried to bring costs down as much as possible for obvious reasons, but they should not have brought them down so low that they sacrifice validation and testing to get there.
The benefits SSD's have over HDD's are enormous and I am sure I am not alone when I say that I would quite happily pay an additional 15-25% than the current prices for my drive knowing that it works, full stop.
QChronoD - Thursday, August 11, 2011 - link
I understand sync and async, but not really sure what toggle means. Is it safe to assume that means that it can switch between the two modes? Or is there something else that is special about it?Nickel020 - Thursday, August 11, 2011 - link
It's a different NAND standard. Intel/Micron NAND follows the ONFI standard (which they developed afaik), Toggle is another standard that's developed by Samsung and others, the Toggle NAND in SF2281 SSDs is 34nm from Toshiba.If I understand it correctly, the difference is mainly the interface, with which the MLC cells are connected to the controller. Both are MLC though, the basic principle on which they are based is the same.
The Toggle NAND SSDs are generally faster, because 34nm means less density, more NAND dies, and thus more interleaving. Same thing causes bigger SSDs to be faster than smaller ones (read Anands other recent articles if you want to know more).
Conscript - Thursday, August 11, 2011 - link
is there a reason the same products aren't in every graph? Corsair GT seems to be missing from quite a few?Anand Lal Shimpi - Thursday, August 11, 2011 - link
Fixed :)Take care,
Anand
Shadowmaster625 - Thursday, August 11, 2011 - link
Is there a way you can force the drive to run at SATA2 speeds to see if that eliminates the lockups?irev210 - Thursday, August 11, 2011 - link
You open this SandForce article on Intel 320 SSDs firmware bug.I love how the BSOD is a page two reference.
Anand, your OCZ/sandforce bias bleeds through pretty hard. I hope you can be a bit more objective with your reports moving forward.
The speed difference between SSDs at this point is pretty trivial. As you continue to hammer about reliability, you never even reviewed the Samsung 470, rarely talk about the Crucial C300/M4, and Toshiba seems to be an afterthought.
At least tomshardware made an attempt to look at SSD reliability.
Bottom line, it seems like sandforce-driven ssds have the biggest number of issues, yet you still recommend them. You say "well I never really experience the issues" but just because you don't doesn't mean that it is the most reliable drive.
I think you should work a little harder at focusing on reliability studies instead of performance metrics. For most users, it taking 1.53 seconds or 1.54 seconds to open an application is pretty irrelevant if SSD A is 10x more likely to fail over SSD B.