The SandForce Roundup: Corsair, Kingston, Patriot, OCZ, OWC & MemoRight SSDs Compared
by Anand Lal Shimpi on August 11, 2011 12:01 AM ESTRandom Read/Write Speed
The four corners of SSD performance are as follows: random read, random write, sequential read and sequential write speed. Random accesses are generally small in size, while sequential accesses tend to be larger and thus we have the four Iometer tests we use in all of our reviews.
Our first test writes 4KB in a completely random pattern over an 8GB space of the drive to simulate the sort of random access that you'd see on an OS drive (even this is more stressful than a normal desktop user would see). I perform three concurrent IOs and run the test for 3 minutes. The results reported are in average MB/s over the entire time. We use both standard pseudo randomly generated data for each write as well as fully random data to show you both the maximum and minimum performance offered by SandForce based drives in these tests. The average performance of SF drives will likely be somewhere in between the two values for each drive you see in the graphs. For an understanding of why this matters, read our original SandForce article.
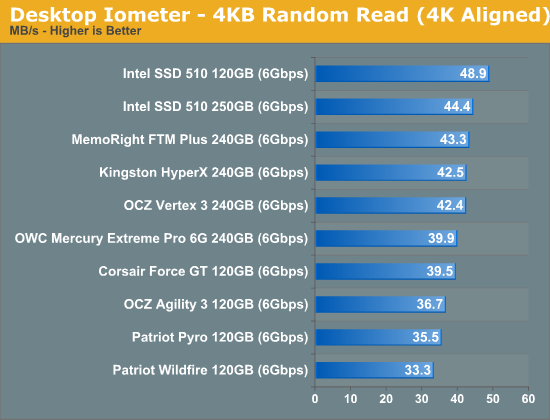
Random read performance is pretty consistent across all of the SF-2281 drives. The Patriot drives lose a bit of performance thanks to their choice in NAND (asynchronous IMFT in the case of the Pyro and Toggle NAND in the case of the Wildfire).
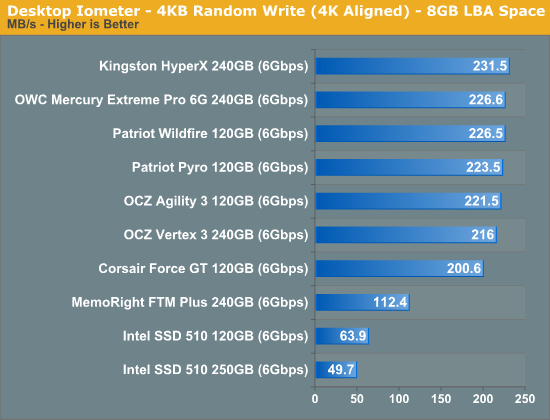
Most random writes are highly compressible and thus all of the SF-2281 drives do very well here. There's no real advantage to synchronous vs. asynchronous NAND here since most of the writes never make it to NAND in the first place. The Agility 3 and Vertex 3 here both use their original firmware while the newer drives are running the latest firmware updates from SandForce. The result is a slight gain in performance, but all things equal you won't see a difference in performance between these drives.
The MemoRight FTM Plus is the only exception here. Its firmware caps peak random write performance over an extended period of time. This is a trick you may remember from the SF-1200 days. It's almost entirely gone from the SF-2281 drives we've reviewed. The performance cap here will almost never surface in real world performance. Based on what we've seen, if you can sustain more than 50MB/s in random writes you're golden for desktop workloads. The advantage SandForce drives have is they tend to maintain these performance levels better than other controllers thanks to their real-time compression/dedupe logic.
Many of you have asked for random write performance at higher queue depths. What I have below is our 4KB random write test performed at a queue depth of 32 instead of 3. While the vast majority of desktop usage models experience queue depths of 0 - 5, higher depths are possible in heavy I/O (and multi-user) workloads:
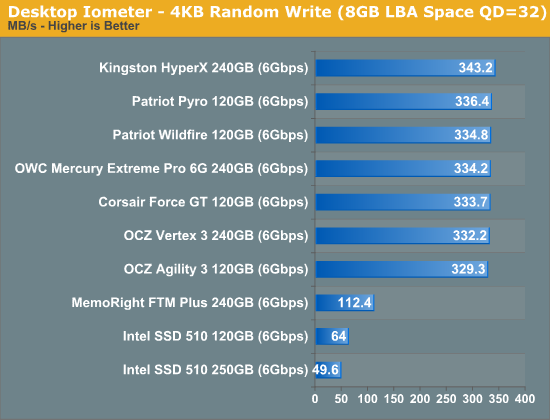
All of the SF-2281 drives do better with a heavier load. The MemoRight drive is still capped at around 112MB/s here.
Sequential Read/Write Speed
To measure sequential performance I ran a 1 minute long 128KB sequential test over the entire span of the drive at a queue depth of 1. The results reported are in average MB/s over the entire test length.
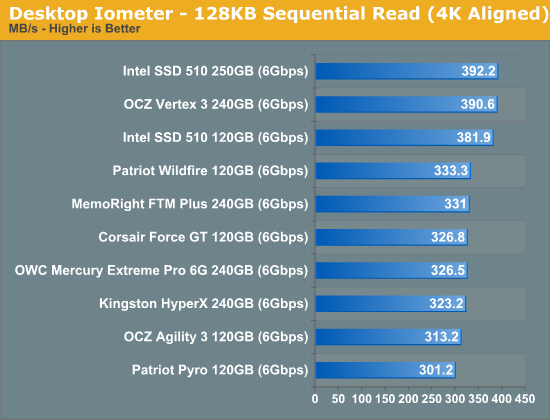
The older SF-2281 firmwares did a bit better in some tests than the newer versions, hence the Vertex 3 being at the top here. All of the newer drives perform pretty similarly in our sequential read test.
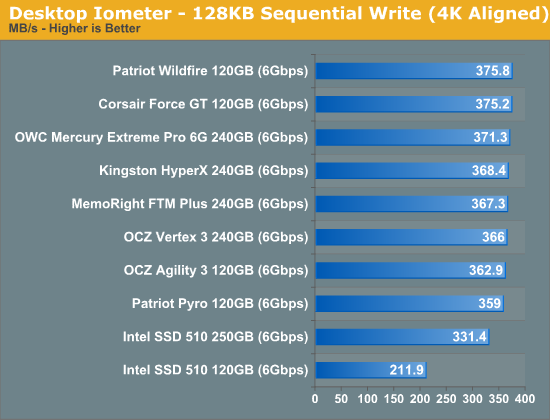
The same goes for our sequential write test - all of the SF-2281 drives perform very similarly.


90 Comments
View All Comments
imaheadcase - Thursday, August 11, 2011 - link
I was wondering the same thing...this seems to happen a lot lately with roundups.Anand Lal Shimpi - Thursday, August 11, 2011 - link
My apologies! An older version of the graphs made its way live, I've updated all of the charts :)Take care,
Anand
Nickel020 - Thursday, August 11, 2011 - link
I always thought the difference in price between a 25nm SF1200 drive and a synchronous SF2200 was mainly due to the cost of the controller, but since you put the controller at $25, it's the NAND in the SF1200 that must be cheaper.A Corsair F115 with synchronous 25nm (G08CAMDB)* costs $170, a Force 3 with asynchronous NAND costs $185 and a Force GT with synchronous NAND costs $245. The synchronous NAND in the F115 must be way cheaper than the synchronous in the Force GT thus.
I'm guessing the SF2200 is more expensive than the SF1200, so that basically means that following your cost breakdown, the asynchronous NAND in drives such as the Force 3 or Agility 3 must be similarly priced as the synchronous NAND in the 25nm SF1200 drives.
Why is the synchronous in the SF1200 drives so much cheaper than the one in the SF1200 drives? Could you decipher the the whole part number?
*I'm assuming the F115 uses the same NAND as the first Vertex 2s with 25nm:
http://www.tomshardware.de/ocz-vertex-2-25nm-ssd,t...
Coup27 - Thursday, August 11, 2011 - link
If the current state of affairs are due to the reasons you have outlined in the first couple of paragraphs then this has been brought on by the manufacturers themselves.All the manufacturers have tried to bring costs down as much as possible for obvious reasons, but they should not have brought them down so low that they sacrifice validation and testing to get there.
The benefits SSD's have over HDD's are enormous and I am sure I am not alone when I say that I would quite happily pay an additional 15-25% than the current prices for my drive knowing that it works, full stop.
QChronoD - Thursday, August 11, 2011 - link
I understand sync and async, but not really sure what toggle means. Is it safe to assume that means that it can switch between the two modes? Or is there something else that is special about it?Nickel020 - Thursday, August 11, 2011 - link
It's a different NAND standard. Intel/Micron NAND follows the ONFI standard (which they developed afaik), Toggle is another standard that's developed by Samsung and others, the Toggle NAND in SF2281 SSDs is 34nm from Toshiba.If I understand it correctly, the difference is mainly the interface, with which the MLC cells are connected to the controller. Both are MLC though, the basic principle on which they are based is the same.
The Toggle NAND SSDs are generally faster, because 34nm means less density, more NAND dies, and thus more interleaving. Same thing causes bigger SSDs to be faster than smaller ones (read Anands other recent articles if you want to know more).
Conscript - Thursday, August 11, 2011 - link
is there a reason the same products aren't in every graph? Corsair GT seems to be missing from quite a few?Anand Lal Shimpi - Thursday, August 11, 2011 - link
Fixed :)Take care,
Anand
Shadowmaster625 - Thursday, August 11, 2011 - link
Is there a way you can force the drive to run at SATA2 speeds to see if that eliminates the lockups?irev210 - Thursday, August 11, 2011 - link
You open this SandForce article on Intel 320 SSDs firmware bug.I love how the BSOD is a page two reference.
Anand, your OCZ/sandforce bias bleeds through pretty hard. I hope you can be a bit more objective with your reports moving forward.
The speed difference between SSDs at this point is pretty trivial. As you continue to hammer about reliability, you never even reviewed the Samsung 470, rarely talk about the Crucial C300/M4, and Toshiba seems to be an afterthought.
At least tomshardware made an attempt to look at SSD reliability.
Bottom line, it seems like sandforce-driven ssds have the biggest number of issues, yet you still recommend them. You say "well I never really experience the issues" but just because you don't doesn't mean that it is the most reliable drive.
I think you should work a little harder at focusing on reliability studies instead of performance metrics. For most users, it taking 1.53 seconds or 1.54 seconds to open an application is pretty irrelevant if SSD A is 10x more likely to fail over SSD B.