The SandForce Roundup: Corsair, Kingston, Patriot, OCZ, OWC & MemoRight SSDs Compared
by Anand Lal Shimpi on August 11, 2011 12:01 AM ESTAnandTech Storage Bench 2011
Last year we introduced our AnandTech Storage Bench, a suite of benchmarks that took traces of real OS/application usage and played them back in a repeatable manner. I assembled the traces myself out of frustration with the majority of what we have today in terms of SSD benchmarks.
Although the AnandTech Storage Bench tests did a good job of characterizing SSD performance, they weren't stressful enough. All of the tests performed less than 10GB of reads/writes and typically involved only 4GB of writes specifically. That's not even enough exceed the spare area on most SSDs. Most canned SSD benchmarks don't even come close to writing a single gigabyte of data, but that doesn't mean that simply writing 4GB is acceptable.
Originally I kept the benchmarks short enough that they wouldn't be a burden to run (~30 minutes) but long enough that they were representative of what a power user might do with their system.
Not too long ago I tweeted that I had created what I referred to as the Mother of All SSD Benchmarks (MOASB). Rather than only writing 4GB of data to the drive, this benchmark writes 106.32GB. It's the load you'd put on a drive after nearly two weeks of constant usage. And it takes a *long* time to run.
1) The MOASB, officially called AnandTech Storage Bench 2011 - Heavy Workload, mainly focuses on the times when your I/O activity is the highest. There is a lot of downloading and application installing that happens during the course of this test. My thinking was that it's during application installs, file copies, downloading and multitasking with all of this that you can really notice performance differences between drives.
2) I tried to cover as many bases as possible with the software I incorporated into this test. There's a lot of photo editing in Photoshop, HTML editing in Dreamweaver, web browsing, game playing/level loading (Starcraft II & WoW are both a part of the test) as well as general use stuff (application installing, virus scanning). I included a large amount of email downloading, document creation and editing as well. To top it all off I even use Visual Studio 2008 to build Chromium during the test.
The test has 2,168,893 read operations and 1,783,447 write operations. The IO breakdown is as follows:
| AnandTech Storage Bench 2011 - Heavy Workload IO Breakdown | ||||
| IO Size | % of Total | |||
| 4KB | 28% | |||
| 16KB | 10% | |||
| 32KB | 10% | |||
| 64KB | 4% | |||
Only 42% of all operations are sequential, the rest range from pseudo to fully random (with most falling in the pseudo-random category). Average queue depth is 4.625 IOs, with 59% of operations taking place in an IO queue of 1.
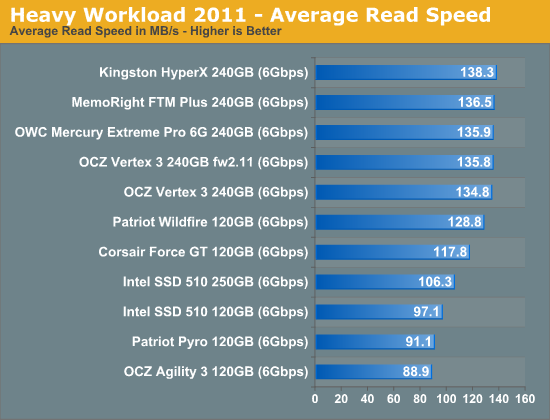
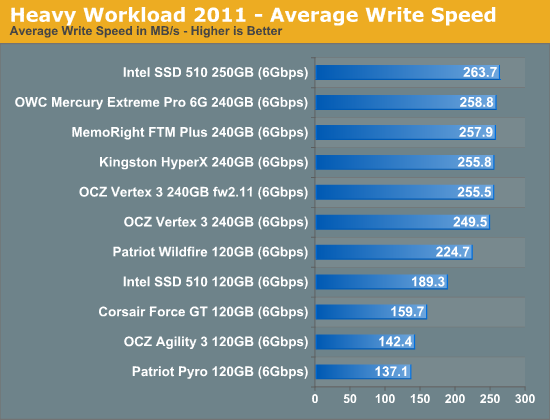
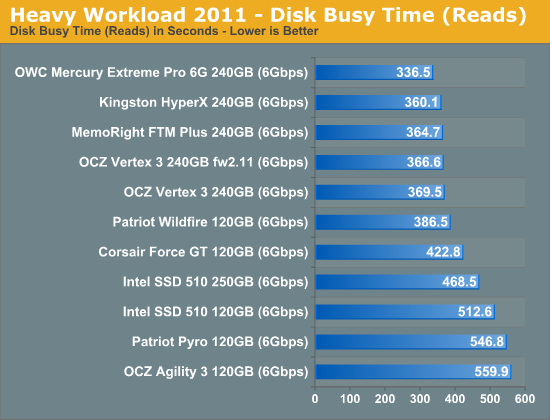
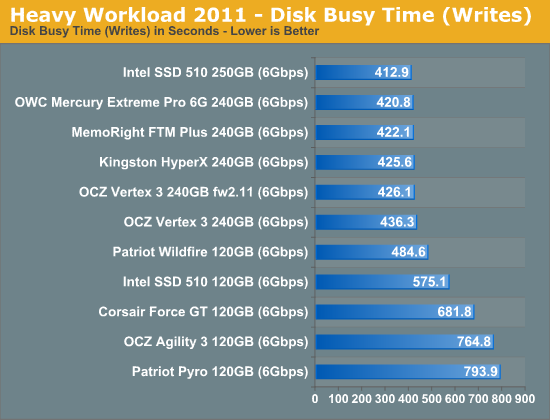
Many of you have asked for a better way to really characterize performance. Simply looking at IOPS doesn't really say much. As a result I'm going to be presenting Storage Bench 2011 data in a slightly different way. We'll have performance represented as Average MB/s, with higher numbers being better. At the same time I'll be reporting how long the SSD was busy while running this test. These disk busy graphs will show you exactly how much time was shaved off by using a faster drive vs. a slower one during the course of this test. Finally, I will also break out performance into reads, writes and combined. The reason I do this is to help balance out the fact that this test is unusually write intensive, which can often hide the benefits of a drive with good read performance.
There's also a new light workload for 2011. This is a far more reasonable, typical every day use case benchmark. Lots of web browsing, photo editing (but with a greater focus on photo consumption), video playback as well as some application installs and gaming. This test isn't nearly as write intensive as the MOASB but it's still multiple times more write intensive than what we were running last year.
As always I don't believe that these two benchmarks alone are enough to characterize the performance of a drive, but hopefully along with the rest of our tests they will help provide a better idea.
The testbed for Storage Bench 2011 has changed as well. We're now using a Sandy Bridge platform with full 6Gbps support for these tests. All of the older tests are still run on our X58 platform.
AnandTech Storage Bench 2011 - Heavy Workload
We'll start out by looking at average data rate throughout our new heavy workload test:
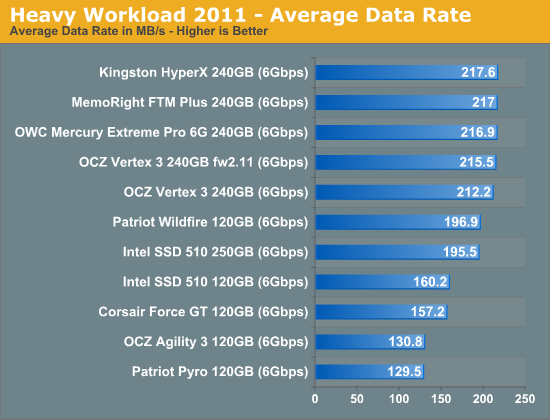
Our Storage Bench suite groups performers according to die count/drive capacity. The 240GB drives are faster than the 120GB counterparts. There's also not much of a difference between the drives with synchronous vs. asynchronous NAND.
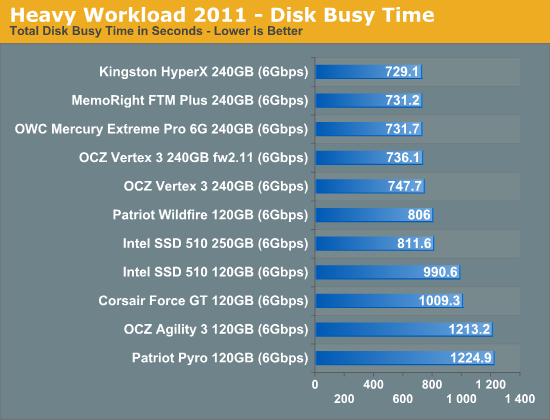
The next three charts just represent the same data, but in a different manner. Instead of looking at average data rate, we're looking at how long the disk was busy for during this entire test. Note that disk busy time excludes any and all idles, this is just how long the SSD was busy doing something:


90 Comments
View All Comments
V3ctorPT - Thursday, August 11, 2011 - link
Exactly what I think, I have an X25-M 160Gb and that thing is still working flawlessly with the advertised speeds, every week he gets the Intel Optimizer and it's good...Even my Gskill Falcon 1 64Gb is doing great, no BSOD's, no unexpected problems, the only "bad" thing that I saw was in SSD Life Free, when it say's my SSD is at 80% of NAND wear n' tear, my Intel is at 100%.
CrystalDisk Info confirms those conditions (that SSD Life reports), Anand, do you think these "tools" are trust worthy? Or they're some sort of scam?
SjarbaDarba - Sunday, August 14, 2011 - link
Where I work - we have had 265 Vertex II drives come back since June 2010.That's one every day or two since for our 1 store, hardly reliable tech.
Ikefu - Thursday, August 11, 2011 - link
"a 64Gb 25nm NAND die will set you back somewhere from $10 - $20. If we assume the best case scenario that's $160 for the NAND alone"I think you meant to say an 8Gb Nand die will set you back $10-$20. Not 64Gb
Yay math typos. Those are always hard to catch.
bobbozzo - Thursday, August 11, 2011 - link
No, 64Gb = 8GBNote the capitalization/case.
Ryan Smith - Thursday, August 11, 2011 - link
We're using gigaBITs (little b), not gigaBYTEs (big B).64Gb x 16 modules / 8 bits-to-bites = 128GBytes.
Ikefu - Thursday, August 11, 2011 - link
Ah Capitalization for the loss, I see my error now. Thank you =)Later in the article they refer to 8GB so the switch from Gigabits to Gigabytes through me.
philosofool - Thursday, August 11, 2011 - link
I made the same mistake at first.Can I request that, in the future, we write either in terms of bytes or bits for the same type of part? There's no need to switch from bits to bytes when talking about storage capacity and you just confuse a reader or two when you do.
nbrenner - Thursday, August 11, 2011 - link
I understand the GB vs Gb argument, but even if it takes 8 modules to make up 64Gb it was stated that a 64Gb die would set you back $10-$20, so saying a 128Gb drive would cost $160 didn't make any sense until 3 paragraphs later when it said the largest die you could get is 8GB.I think most of us read that if 64Gb is $10-$20, then why in the world would it cost $160 to get to 128Gb?
Death666Angel - Friday, August 12, 2011 - link
Unless he edited it, it clearly states "128GB". I think the b=bit and B=byte is quite clear, though I would not complain if they stick with one thing and not change it in between. :-)Mathieu Bourgie - Thursday, August 11, 2011 - link
Once again, a fantastic article from you Anand on SSDs.I couldn't agree more on the state of consumer SSDs and their reliability (or lack of...).
The problem as you mentioned is the small margins that manufacturers are getting (if they are actually manufacturing it...), which results in less QA than required and products that launch with too many bugs. The issue is, this won't go away, because many customers do want the price per GB to go down before they'll buy. Probably waiting for that psychological $1 per GB, that same 1$ per GB that HDDs reached many years ago.
With prices per GiB (actual capacity in Windows) dropping below $1.50, reliability is one of the last barrier for SSDs to actually become mainstream. Most power users now have one or are considering one, but SSDs are still very rare in most desktops/laptops sold by HP, Dell and the like. Sometimes they will be offered as an option (with additional cost), but rarely as a standard drive (only a handful or two of exceptions come to mind for laptops).
I can only hope that the reliability situation improves, because I do wish to see a major computing breakthrough, that is for SSDs to replace HDDs entirely one day. As you said years ago in an early SSD article, once you had a SSD, you can't go without one.
My desktop used to have two Samsung F3 1TB in RAID 0. Switching to it from my laptop (which had an Intel 120GB X25-M G2) was almost painful. Being accustomed to the speed of the SSD, the HDDs felt awfully slow. And I'm talking about two top of the line (besides raptors) HDDs in RAID 0 here, not a five year old IDE HDD here.
It's always a pleasure to read your articles Anand, keep up the outstanding work!