OWC Mercury Extreme Pro 6G SSD Review (120GB)
by Anand Lal Shimpi on May 5, 2011 1:45 AM ESTAnandTech Storage Bench 2010
To keep things consistent we've also included our older Storage Bench. Note that the old storage test system doesn't have a SATA 6Gbps controller, so we only have one result for the 6Gbps drives.
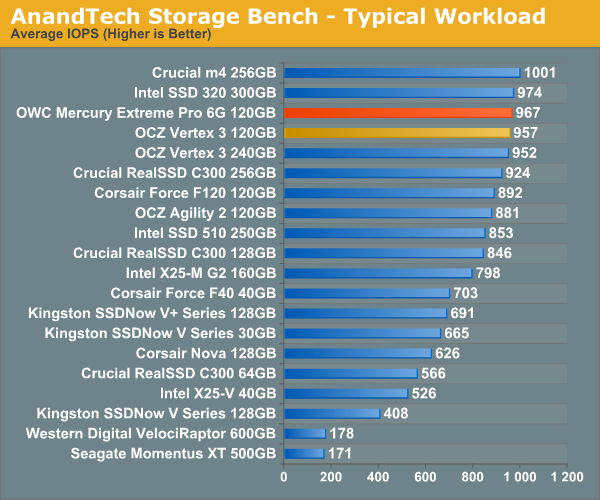
The first in our benchmark suite is a light/typical usage case. The Windows 7 system is loaded with Firefox, Office 2007 and Adobe Reader among other applications. With Firefox we browse web pages like Facebook, AnandTech, Digg and other sites. Outlook is also running and we use it to check emails, create and send a message with a PDF attachment. Adobe Reader is used to view some PDFs. Excel 2007 is used to create a spreadsheet, graphs and save the document. The same goes for Word 2007. We open and step through a presentation in PowerPoint 2007 received as an email attachment before saving it to the desktop. Finally we watch a bit of a Firefly episode in Windows Media Player 11.
There’s some level of multitasking going on here but it’s not unreasonable by any means. Generally the application tasks proceed linearly, with the exception of things like web browsing which may happen in between one of the other tasks.
The recording is played back on all of our drives here today. Remember that we’re isolating disk performance, all we’re doing is playing back every single disk access that happened in that ~5 minute period of usage. The light workload is composed of 37,501 reads and 20,268 writes. Over 30% of the IOs are 4KB, 11% are 16KB, 22% are 32KB and approximately 13% are 64KB in size. Less than 30% of the operations are absolutely sequential in nature. Average queue depth is 6.09 IOs.
The performance results are reported in average I/O Operations per Second (IOPS):
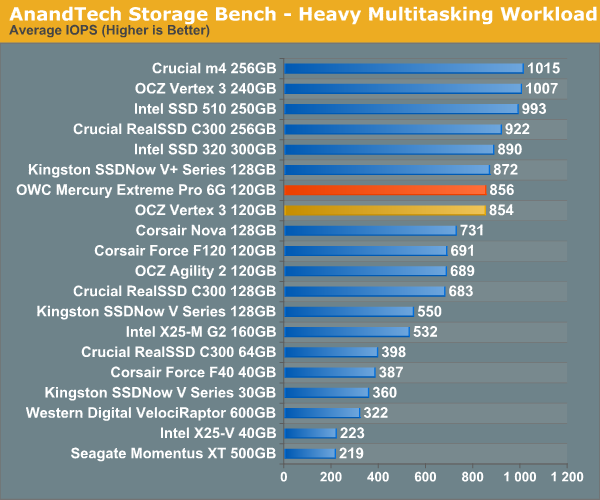
If there’s a light usage case there’s bound to be a heavy one. In this test we have Microsoft Security Essentials running in the background with real time virus scanning enabled. We also perform a quick scan in the middle of the test. Firefox, Outlook, Excel, Word and Powerpoint are all used the same as they were in the light test. We add Photoshop CS4 to the mix, opening a bunch of 12MP images, editing them, then saving them as highly compressed JPGs for web publishing. Windows 7’s picture viewer is used to view a bunch of pictures on the hard drive. We use 7-zip to create and extract .7z archives. Downloading is also prominently featured in our heavy test; we download large files from the Internet during portions of the benchmark, as well as use uTorrent to grab a couple of torrents. Some of the applications in use are installed during the benchmark, Windows updates are also installed. Towards the end of the test we launch World of Warcraft, play for a few minutes, then delete the folder. This test also takes into account all of the disk accesses that happen while the OS is booting.
The benchmark is 22 minutes long and it consists of 128,895 read operations and 72,411 write operations. Roughly 44% of all IOs were sequential. Approximately 30% of all accesses were 4KB in size, 12% were 16KB in size, 14% were 32KB and 20% were 64KB. Average queue depth was 3.59.
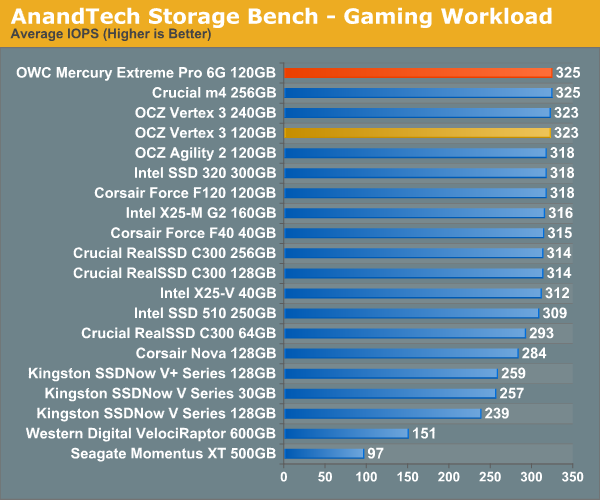
The gaming workload is made up of 75,206 read operations and only 4,592 write operations. Only 20% of the accesses are 4KB in size, nearly 40% are 64KB and 20% are 32KB. A whopping 69% of the IOs are sequential, meaning this is predominantly a sequential read benchmark. The average queue depth is 7.76 IOs.


44 Comments
View All Comments
altermaan - Thursday, May 5, 2011 - link
nice review though I'll most likely buy either the vertex 3 120GB max iops or the crucial m4 128GB. speaking of which: are there any plans of reviewing those two drives in the near future? I (and I think I'm might not be the only one) am desperately waiting for this as I don't wanna spend $300 for the wrong drive.greets
A
Nicolas Pillot - Thursday, May 5, 2011 - link
I see from the graphs, that- sequential read are faster than sequencial write, which seems ok
- random write are faster than random read, which seems illogical
That's the case for each and every ssd drive (well as far as i have checked)
Could somebody please explain this to me ?
Nihility - Thursday, May 5, 2011 - link
I'm not promising that this is the 100% correct reason, however it's possible that the random writes are being made to the cache (SSD's RAM) so that's quicker. While the reads have to be made from the actual flash storage.andymcca - Thursday, May 5, 2011 - link
Caching is another possible explanation, but if you run a test for any length of time (and I'm guessing the reviewers here do) logic dictates that your buffer will fill up if input rate > output rate.7Enigma - Thursday, May 5, 2011 - link
Makes sense to me. Writing to the drive only requires knowing where to put the data (ie is this block of space free or not). It's basically a limitation of how fast the cpu can deliver write requests to the SSD (so only 2 variables essentially).Random read on the other hand has an added variable of first FINDING the data on the SSD after the read request is made by the CPU. The latency of finding that data (as compared to writing in a free block) is where the performance difference occurs. This is why mechanical drives are so much slower than SSD's, but there still is an overhead on the "finding" part.
andymcca - Thursday, May 5, 2011 - link
Writes on SSDs are to wherever the drive wants to put them (not to a pre-defined physical location). Reads have to come from a pre-defined location, since that is where the data was already put. Basically, SSDs have to hunt for your read data, but put your write data somewhere convenient.JasonInofuentes - Thursday, May 5, 2011 - link
Could the power differences be a result of binning? Could be part of the perk of being Sandforce's favorite client.Thanks.
Jason
andymcca - Thursday, May 5, 2011 - link
My guess is that it has to do more with the memory and less with the controller, but IANAexpertaraczynski - Thursday, May 5, 2011 - link
I don't mean this as a stupid question (apologies if it is) but why not include a traditional platter driver in the ATStorageBench2011? Sometimes comparing apples to apples doesn't have the impact as when you also throw in an orange into the mix to help visualize what you're seeing.average MB/s of 100-200 on a certain bench doesn't mean much to me personally when i don't know how it compares to a traditional drive.
MilwaukeeMike - Thursday, May 5, 2011 - link
I agree. I like the Velociraptor included on some graphs because I own one, and know what the comparison is. These charts help us realize which SSD might suit our purposes best, but the question many of us are really wondering is 'should I upgrade to one at all?'The easy answer is 'yes', but having MS Word open in 1 second instead of 2 doesn't matter to me. Having my games load in 5 seconds instead of 25 does. But without an old school drive on the benchmark table we can't quantify SSD to HDD.
Review is great for SSD to SSD, don't get me wrong :)