The Intel SSD 320 Review: 25nm G3 is Finally Here
by Anand Lal Shimpi on March 28, 2011 11:08 AM EST- Posted in
- IT Computing
- Storage
- SSDs
- Intel
- Intel SSD 320
AnandTech Storage Bench 2011: Much Heavier
I didn't expect to have to debut this so soon, but I've been working on updated benchmarks for 2011. Last year we introduced our AnandTech Storage Bench, a suite of benchmarks that took traces of real OS/application usage and played them back in a repeatable manner. I assembled the traces myself out of frustration with the majority of what we have today in terms of SSD benchmarks.
Although the AnandTech Storage Bench tests did a good job of characterizing SSD performance, they weren't stressful enough. All of the tests performed less than 10GB of reads/writes and typically involved only 4GB of writes specifically. That's not even enough exceed the spare area on most SSDs. Most canned SSD benchmarks don't even come close to writing a single gigabyte of data, but that doesn't mean that simply writing 4GB is acceptable.
Originally I kept the benchmarks short enough that they wouldn't be a burden to run (~30 minutes) but long enough that they were representative of what a power user might do with their system.
Not too long ago I tweeted that I had created what I referred to as the Mother of All SSD Benchmarks (MOASB). Rather than only writing 4GB of data to the drive, this benchmark writes 106.32GB. It's the load you'd put on a drive after nearly two weeks of constant usage. And it takes a *long* time to run.
I'll be sharing the full details of the benchmark in some upcoming SSD articles but here are some details:
1) The MOASB, officially called AnandTech Storage Bench 2011 - Heavy Workload, mainly focuses on the times when your I/O activity is the highest. There is a lot of downloading and application installing that happens during the course of this test. My thinking was that it's during application installs, file copies, downloading and multitasking with all of this that you can really notice performance differences between drives.
2) I tried to cover as many bases as possible with the software I incorporated into this test. There's a lot of photo editing in Photoshop, HTML editing in Dreamweaver, web browsing, game playing/level loading (Starcraft II & WoW are both a part of the test) as well as general use stuff (application installing, virus scanning). I included a large amount of email downloading, document creation and editing as well. To top it all off I even use Visual Studio 2008 to build Chromium during the test.
Many of you have asked for a better way to really characterize performance. Simply looking at IOPS doesn't really say much. As a result I'm going to be presenting Storage Bench 2011 data in a slightly different way. We'll have performance represented as Average MB/s, with higher numbers being better. At the same time I'll be reporting how long the SSD was busy while running this test. These disk busy graphs will show you exactly how much time was shaved off by using a faster drive vs. a slower one during the course of this test. Finally, I will also break out performance into reads, writes and combined. The reason I do this is to help balance out the fact that this test is unusually write intensive, which can often hide the benefits of a drive with good read performance.
There's also a new light workload for 2011. This is a far more reasonable, typical every day use case benchmark. Lots of web browsing, photo editing (but with a greater focus on photo consumption), video playback as well as some application installs and gaming. This test isn't nearly as write intensive as the MOASB but it's still multiple times more write intensive than what we were running last year.
As always I don't believe that these two benchmarks alone are enough to characterize the performance of a drive, but hopefully along with the rest of our tests they will help provide a better idea.
The testbed for Storage Bench 2011 has changed as well. We're now using a Sandy Bridge platform with full 6Gbps support for these tests. All of the older tests are still run on our X58 platform.
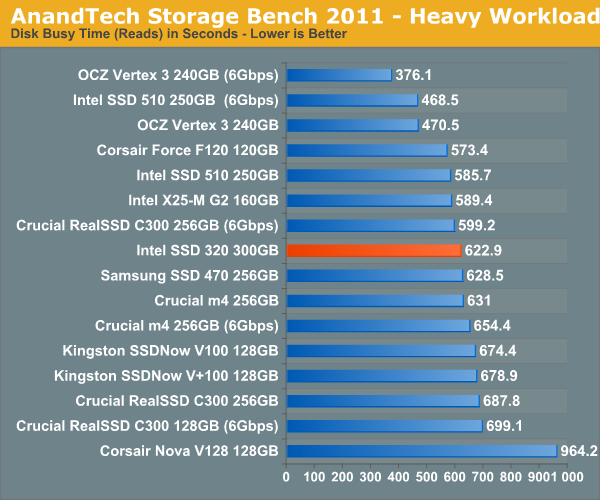
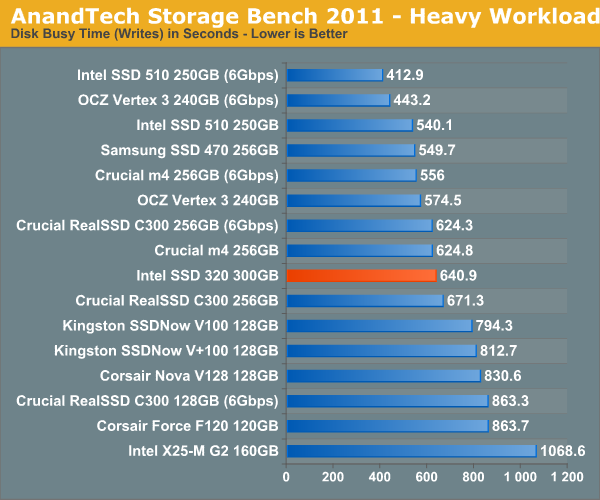
AnandTech Storage Bench 2011 - Heavy Workload
We'll start out by looking at average data rate throughout our new heavy workload test:
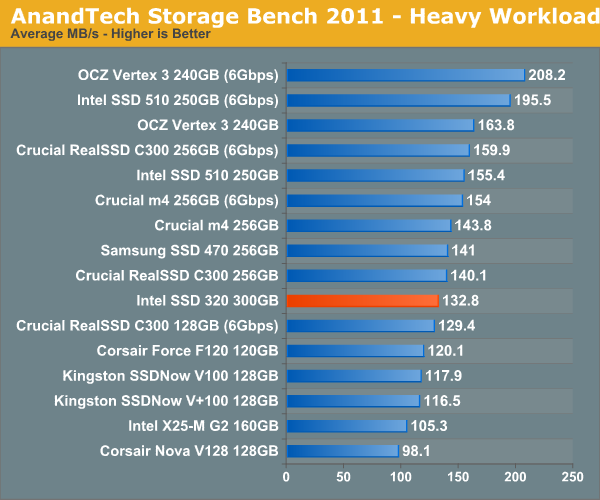
Overall performance is decidedly last generation. The 320 is within striking distance of the 510 but is slower overall in our heavy workload test.
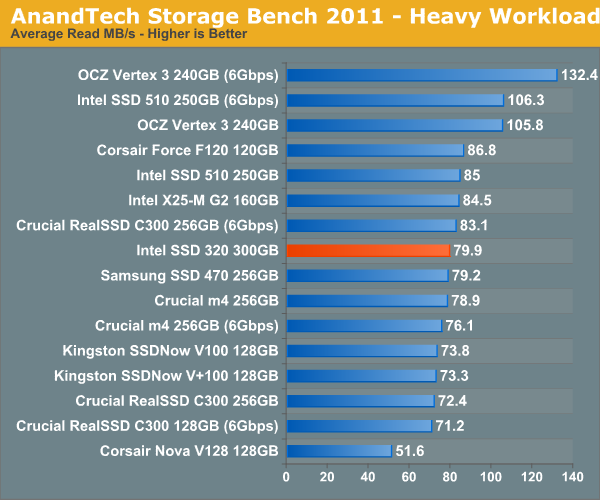
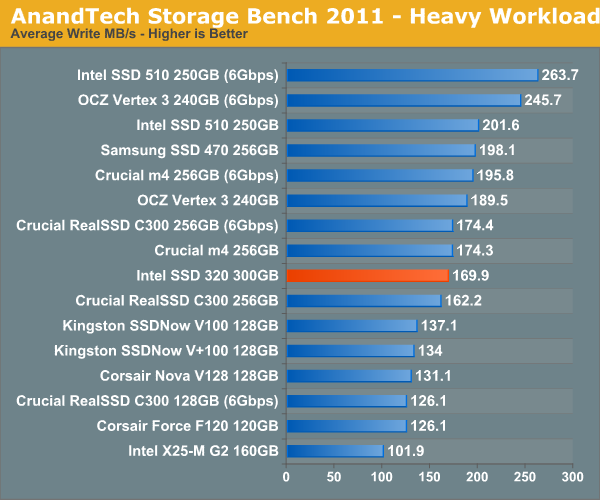
The breakdown of reads vs. writes tells us more of what's going on:
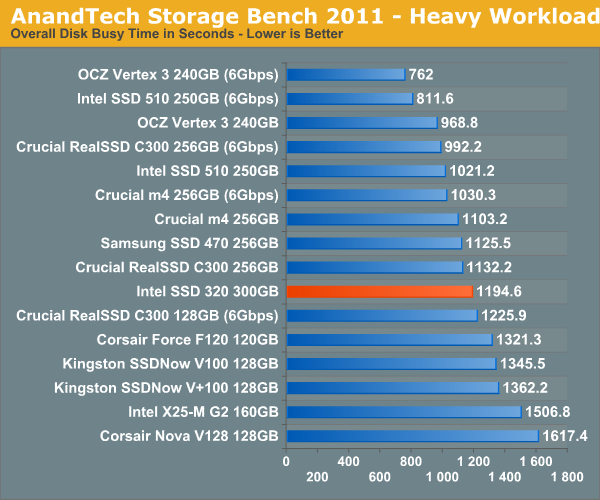
The next three charts just represent the same data, but in a different manner. Instead of looking at average data rate, we're looking at how long the disk was busy for during this entire test. Note that disk busy time excludes any and all idles, this is just how long the SSD was busy doing something:


194 Comments
View All Comments
bji - Monday, March 28, 2011 - link
But don't they? I am pretty sure that the listed price for a 160 GB drive is about the same as I paid for my 80 GB G2 a year ago. Maybe these prices are higher than current prices on the older generation drives but you really should compare products at the same point of their life cycle to be fair. The G3 is half the cost that the G2 was at launch (actually less than half if I am remembering correctly) and in a year when they are at a later point in the product life cycle they wil be half as expensive or less per GB than the G2 is at the same point of its life cycle.qwertymac93 - Monday, March 28, 2011 - link
I think we all knew it wouldn't be as fast as The new sandforces, but i didn't expect it to be so expensive. i guess intel figured people will buy it just because it's intel. Not me though, I'm waiting for next gen(<25nm) ssd's before i make the plunge, i want sub $1 per gig.A5 - Monday, March 28, 2011 - link
Oh well - $170 for 120GB is still pretty good.AnnonymousCoward - Sunday, April 3, 2011 - link
G2 120GB is $230.aork - Monday, March 28, 2011 - link
"That works out to be 320GB of NAND for a drive whose rated capacity is 300GB. In Windows you'll see ~279GB of free space, which leaves 12.8% of the total NAND capacity as spare area."Actually you only see 279 GB of free space in Windows because Windows displays in GiB (2^30 bytes), not true GB (10^9 bytes). In truth, you are only getting the expected 6.25% of the total NAND capacity as spare area.
Stahn Aileron - Monday, March 28, 2011 - link
Flash storage is, as far as I know, always treated as binary multiples, not decimal. SSD drive manufacturers take advantage of the discrepancy between the OS's definition and the HD manufacturers' definition of storage units (GiB - 2^(x*10) - vs GB - 10^(x*3)) to help cover the spare area.It also helps keep everything consistent within the storage industry. Can you imagine the fallout from having a 300GB SSD actually being 300GiB vs an "identically sized" 300GB HDD reporting only 279GiB? If the consumers don't get pissy about that, I'm positive the HDD manufacturers would.
Mr Perfect - Monday, March 28, 2011 - link
Yeah, disappointing really. The switch to SSDs would have been a golden opportunity for drives to format to what the label says. Oh well.Taft12 - Monday, March 28, 2011 - link
Marketing would never allow that. We're not going back to binary measures of storage ever again :(Zan Lynx - Monday, March 28, 2011 - link
And why would we? RAM is the only thing that was ever calculated in powers of 2. Ever.CPU MHz? 10-base.
Network speed? 10-base.
Hard drive capacity? Always 10-base. Since forever!
Making Flash size in base-2 would introduce a new exception, not restore any wondrous old measurement system.
If the label says 300 GB and the box contains 300,000,000,000 bytes, then it does contain exactly what was advertised. Giga as a prefix has always meant 1 billion. Gigahertz? 1 billion cycles per second. Gigameter? 1 billion meters. 1 gigaflops? 1 billion floating point operations per second.
jwilliams4200 - Monday, March 28, 2011 - link
Well said, Zan. I thought that almost everyone knew this, but it is disappointing to see Anand still using the wrong units in his reviews and tables. Windows reports sizes in GiB, but incorrectly labels it GB. Unfortunately, Anand makes the same mistake. Sad.