The Intel SSD 510 Review
by Anand Lal Shimpi on March 2, 2011 1:23 AM EST- Posted in
- IT Computing
- Storage
- SSDs
- Intel
- Intel SSD 510
AS-SSD High Queue Depth Incompressible Sequential Performance
The AS-SSD sequential benchmark takes place at a very high queue depth of 32 and uses incompressible data for all of its transfers. The result is a pretty big reduction in sequential write speed on SandForce based controllers.
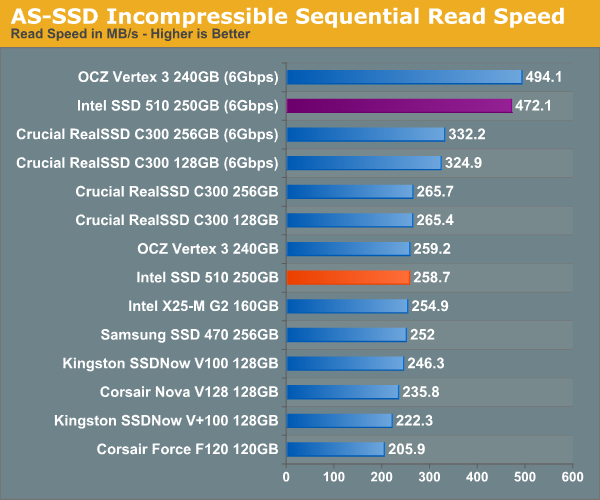
For all intents and purposes, worst case sequential read performance is identical between the Vertex 3 and Intel SSD 510.
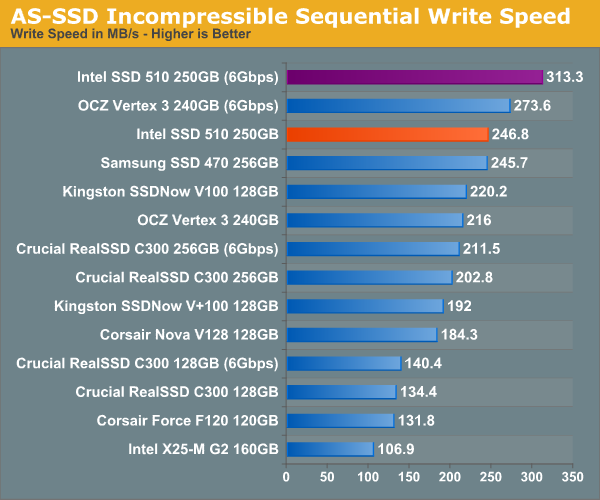
While ATTO showed us the Vertex 3 with a signficant advantage over the 510, AS-SSD gives us the other end of the spectrum. If you're going to be copying a lot of H.264 movies around on your SSD, the 510 will likely have better write performance than the Vertex 3. However if you're copying large databases around instead, the advantage will shift back to OCZ/SF.


128 Comments
View All Comments
masterkritiker - Wednesday, March 2, 2011 - link
When will we be able to buy $100+ SSDs @ 1TB capacity?gammaray - Wednesday, March 2, 2011 - link
nevertno - Thursday, March 3, 2011 - link
+1Nihility - Thursday, March 3, 2011 - link
At least 4 years.ionis - Wednesday, March 2, 2011 - link
It would be nice if some HDDs were also included in workload benches. They were in the random read/write benches so I don't get why they were left out of the other ones.dagamer34 - Wednesday, March 2, 2011 - link
HDDs aren't included because they'd throw off the scale pretty horribly. The number labeling the performance would be larger than the bar itself compared to all the other SSDs out there.ionis - Thursday, March 3, 2011 - link
I find that hard to believe, considering they were included in the random read/write graphs at 1/100 or less of the performance of some of the SSDs and the charts weren't scaled horribly.In the sequential reads/writes, they performed at 25%-80% which doesn't through the scale off much at all.
The heavy workload looked to involve a lot of sequential access (installs and downloads). So again, I don't see why they weren't included.
There are also other comments asking for more HDDs in the benches. For people like myself, who didn't start following storage benchmarks until SSDs came out, it's hard to tell what the performance gain is.
ionis - Thursday, March 3, 2011 - link
I find that hard to believe, considering they were included in the random read/write graphs at 1/100 or less of the performance of some of the SSDs and the charts weren't scaled horribly.In the sequential reads/writes, they performed at 25%-80% which doesn't throw the scale off much at all.
The heavy workload looked to involve a lot of sequential access (installs and downloads). So again, I don't see why they weren't included.
There are also other comments asking for more HDDs in the benches. For people like myself, who didn't start following storage benchmarks until SSDs came out, it's hard to tell what the performance gain is.
(sorry if double post, comment didn't seem to show up 1st time)
mateus1987 - Wednesday, March 2, 2011 - link
now you know.http://nzealander.blog.com/files/2011/03/6661.jpg
mateus1987 - Wednesday, March 2, 2011 - link
the satanic Apple logo.http://nzealander.blog.com/files/2011/03/6661.jpg