The Intel SSD 510 Review
by Anand Lal Shimpi on March 2, 2011 1:23 AM EST- Posted in
- IT Computing
- Storage
- SSDs
- Intel
- Intel SSD 510
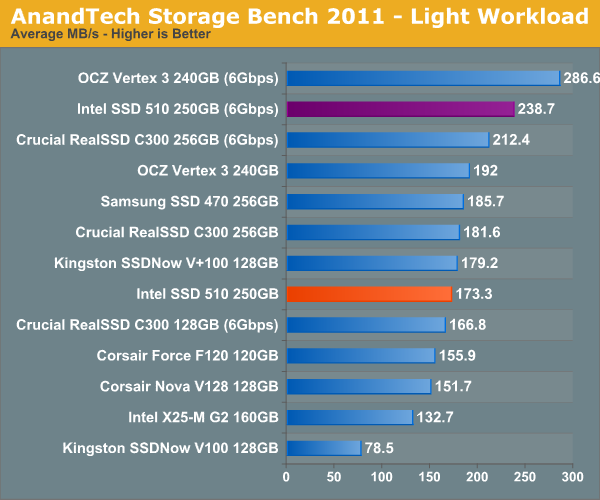
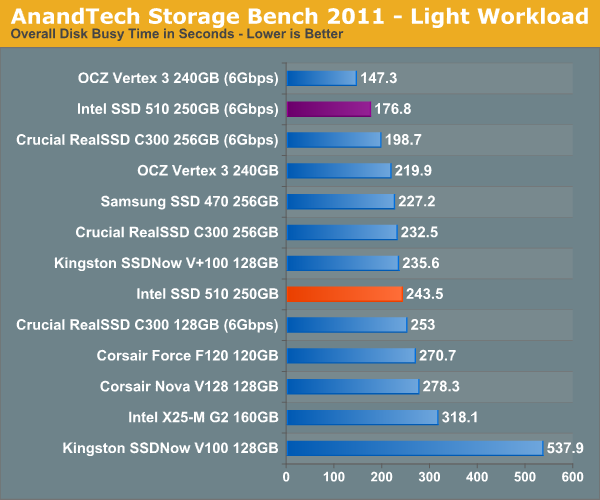
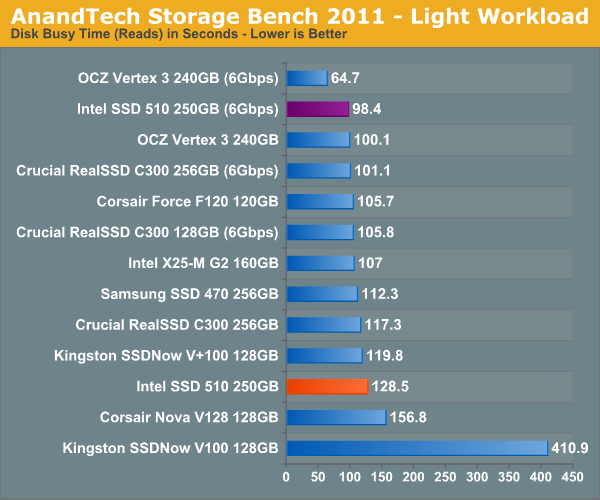
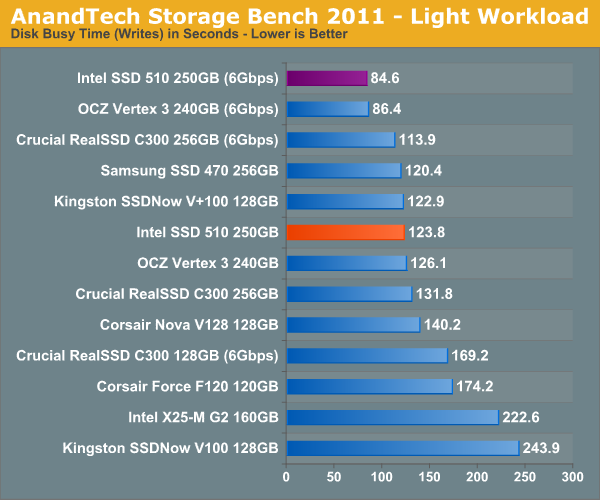
AnandTech Storage Bench 2011 - Light Workload
The performance between the top two isn't nearly as close in our light workload. Here the Vertex 3 is 20% faster than the 510 on average:
The culprit is, once again, read performance:
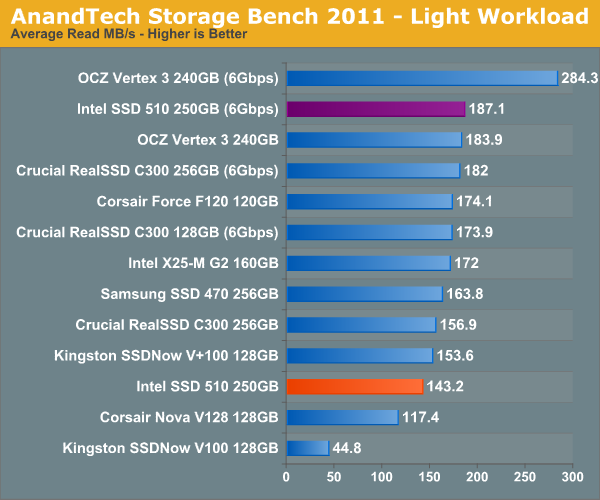
OCZ manages a 51% performance advantage if we just isolate the reads in our benchmark. The Vertex 3 behaves like a next-generation drive and the SSD 510 has the random read performance of an X25-V.
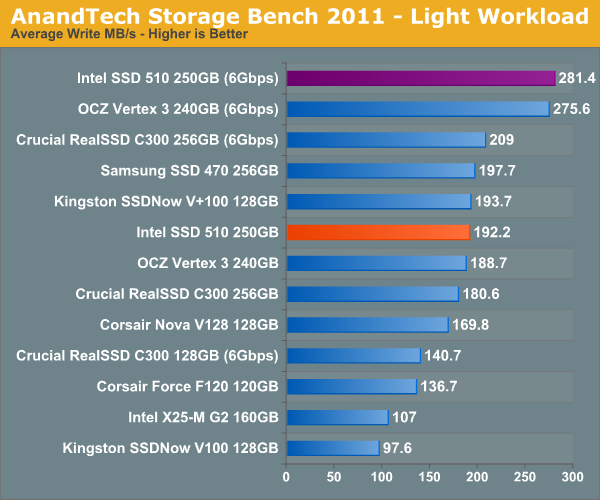
Once again the 510 does quite well when we look at pure write performance. At least based on our 2011 Storage Bench the major weakness here is random read performance - the 510's random write performance is seemingly sufficient for this workload.


128 Comments
View All Comments
masterkritiker - Wednesday, March 2, 2011 - link
When will we be able to buy $100+ SSDs @ 1TB capacity?gammaray - Wednesday, March 2, 2011 - link
nevertno - Thursday, March 3, 2011 - link
+1Nihility - Thursday, March 3, 2011 - link
At least 4 years.ionis - Wednesday, March 2, 2011 - link
It would be nice if some HDDs were also included in workload benches. They were in the random read/write benches so I don't get why they were left out of the other ones.dagamer34 - Wednesday, March 2, 2011 - link
HDDs aren't included because they'd throw off the scale pretty horribly. The number labeling the performance would be larger than the bar itself compared to all the other SSDs out there.ionis - Thursday, March 3, 2011 - link
I find that hard to believe, considering they were included in the random read/write graphs at 1/100 or less of the performance of some of the SSDs and the charts weren't scaled horribly.In the sequential reads/writes, they performed at 25%-80% which doesn't through the scale off much at all.
The heavy workload looked to involve a lot of sequential access (installs and downloads). So again, I don't see why they weren't included.
There are also other comments asking for more HDDs in the benches. For people like myself, who didn't start following storage benchmarks until SSDs came out, it's hard to tell what the performance gain is.
ionis - Thursday, March 3, 2011 - link
I find that hard to believe, considering they were included in the random read/write graphs at 1/100 or less of the performance of some of the SSDs and the charts weren't scaled horribly.In the sequential reads/writes, they performed at 25%-80% which doesn't throw the scale off much at all.
The heavy workload looked to involve a lot of sequential access (installs and downloads). So again, I don't see why they weren't included.
There are also other comments asking for more HDDs in the benches. For people like myself, who didn't start following storage benchmarks until SSDs came out, it's hard to tell what the performance gain is.
(sorry if double post, comment didn't seem to show up 1st time)
mateus1987 - Wednesday, March 2, 2011 - link
now you know.http://nzealander.blog.com/files/2011/03/6661.jpg
mateus1987 - Wednesday, March 2, 2011 - link
the satanic Apple logo.http://nzealander.blog.com/files/2011/03/6661.jpg