The Intel SSD 510 Review
by Anand Lal Shimpi on March 2, 2011 1:23 AM EST- Posted in
- IT Computing
- Storage
- SSDs
- Intel
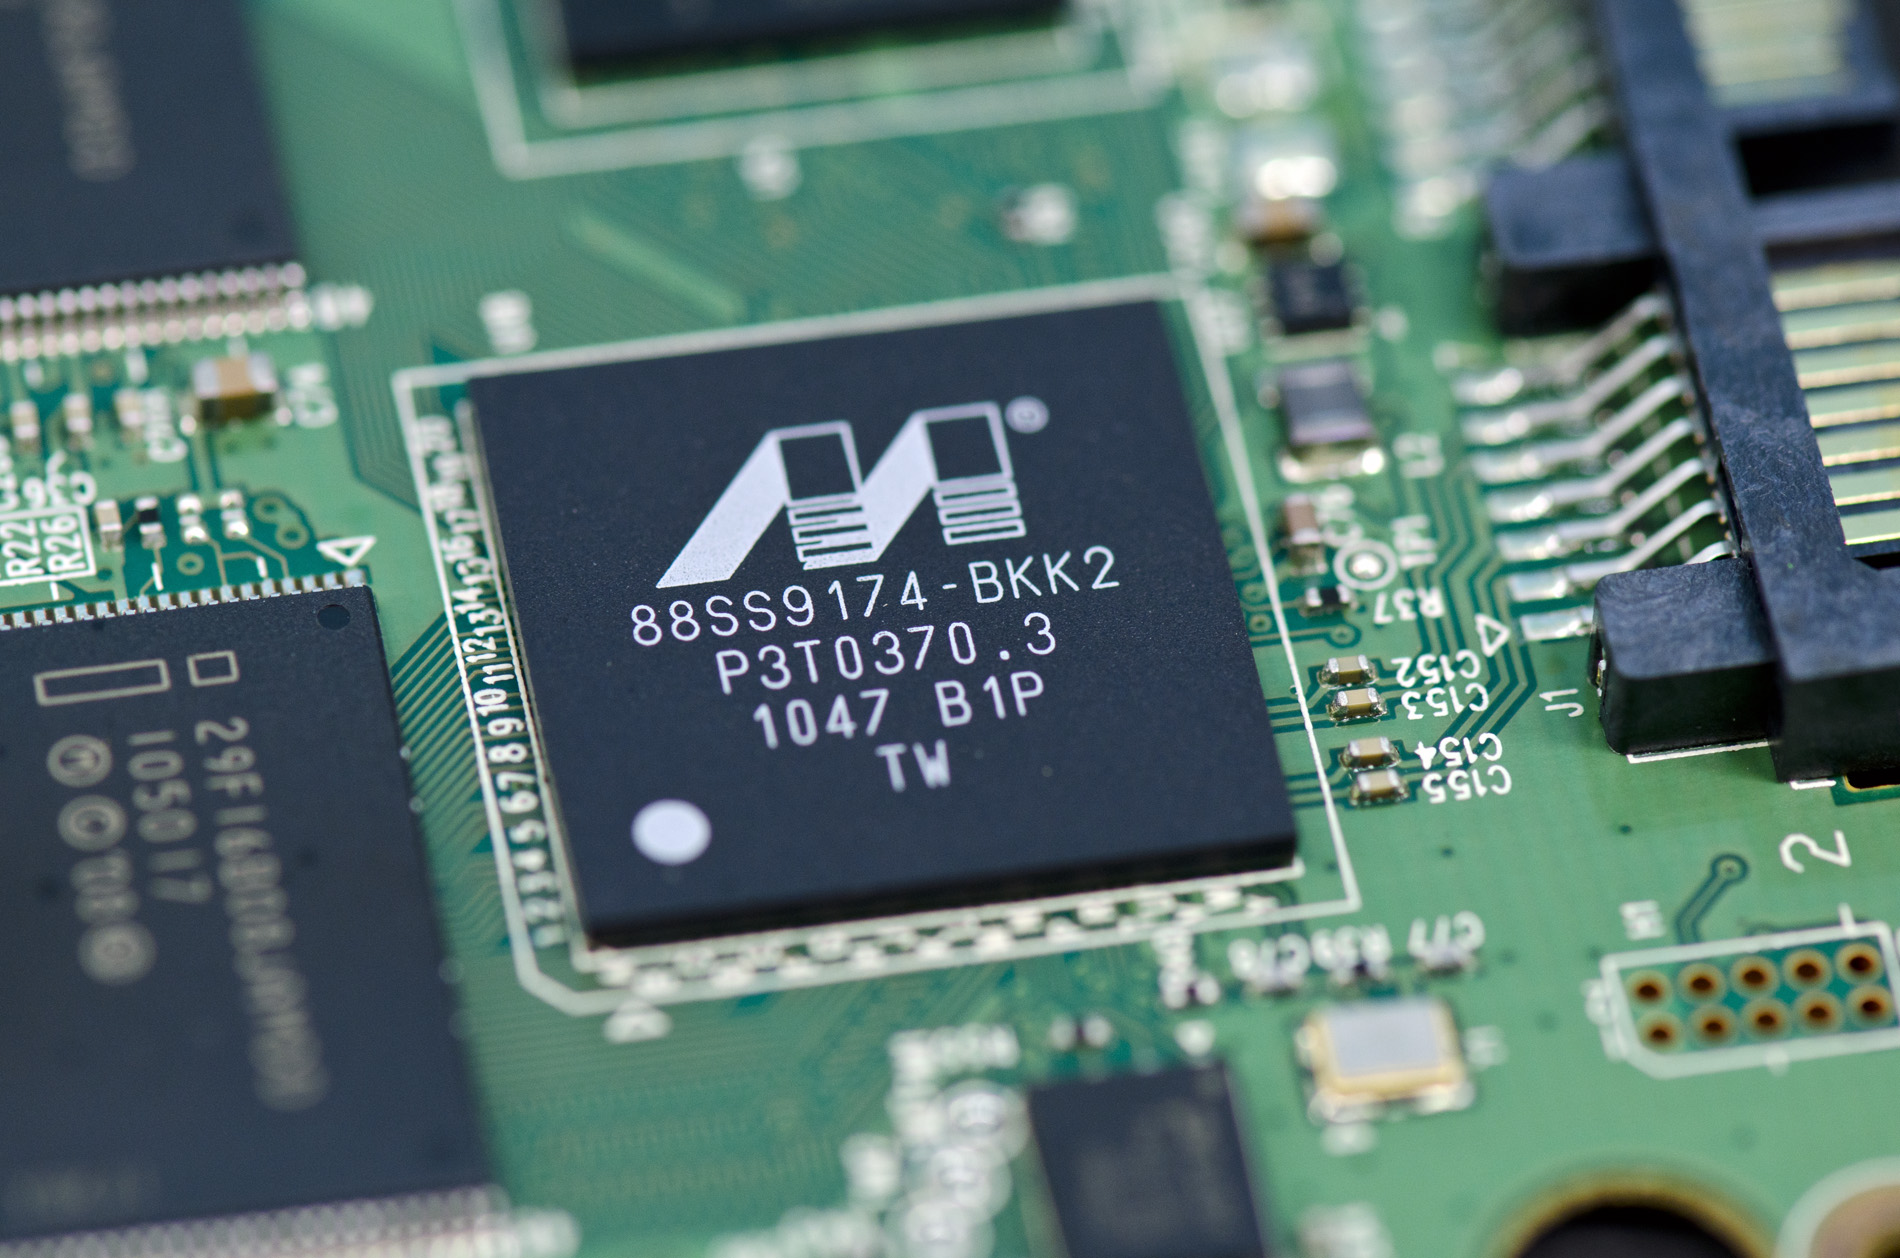
- Intel SSD 510
A Word on Reliability
Marc Prieur has been around writing about hardware for as long as I can remember (think back to the old school Tom days). Late last year he published some particularly controversial numbers on his website: failure rates of various PC components according to a French etailer. Among the components were SSDs and the numbers are below:
| SSD Failure Rates - Hardware.fr | |||||||
| Intel | Corsair | Crucial | Kingston | OCZ | |||
| Failure Percentage | 0.59% | 2.17% | 2.25% | 2.39% | 2.93% | ||
I should add that the numbers Marc published were accurate (confirmed by some of the manufacturers involved), although they don’t paint the complete picture of world wide failure rates - they are an important sample to look at.
Other than Intel, none of the companies listed in that article were particularly pleased with the numbers.
I mentioned earlier that the 510 would go through Intel’s extensive validation testing, just like any other Intel product. Presumably this means that the SSD 510 should have similarly low failure rates in the field (unless there’s something horribly wrong with the Marvell controller that is). Compatibility should also be a strong point of the SSD 510 due to Intel’s stringent internal testing.
Note that I am separating reliability and compatibility from drive longevity. There’s typically a good correlation between high random write performance and low write amplification. The Intel SSD 510 doesn’t have particularly high random write performance, and in turn should suffer from fairly high write amplification in highly random workloads.
I’ve already proved in the past that at 5,000 p/e cycles there’s no cause for worry for a normal desktop user. The likelihood that you’ll wear out all of your NAND within the next 5 years is very, very low. However I will say that when faced with enterprise workloads you’re going to have to pay much closer attention to write amplification and spare area than you would on say a SandForce drive.
The Test
| CPU |
Intel Core i7 965 running at 3.2GHz (Turbo & EIST Disabled) Intel Core i7 2600K running at 3.4GHz (Turbo & EIST Disabled) - for AT SB 2011, AS SSD & ATTO |
| Motherboard: |
Intel DX58SO (Intel X58) Intel H67 Motherboard |
| Chipset: | Intel X58 + Marvell SATA 6Gbps PCIe Intel H67 |
| Chipset Drivers: |
Intel 9.1.1.1015 + Intel IMSM 8.9 Intel 9.1.1.1015 + Intel RST 10.2 |
| Memory: | Qimonda DDR3-1333 4 x 1GB (7-7-7-20) |
| Video Card: | eVGA GeForce GTX 285 |
| Video Drivers: | NVIDIA ForceWare 190.38 64-bit |
| Desktop Resolution: | 1920 x 1200 |
| OS: | Windows 7 x64 |


128 Comments
View All Comments
masterkritiker - Wednesday, March 2, 2011 - link
When will we be able to buy $100+ SSDs @ 1TB capacity?gammaray - Wednesday, March 2, 2011 - link
nevertno - Thursday, March 3, 2011 - link
+1Nihility - Thursday, March 3, 2011 - link
At least 4 years.ionis - Wednesday, March 2, 2011 - link
It would be nice if some HDDs were also included in workload benches. They were in the random read/write benches so I don't get why they were left out of the other ones.dagamer34 - Wednesday, March 2, 2011 - link
HDDs aren't included because they'd throw off the scale pretty horribly. The number labeling the performance would be larger than the bar itself compared to all the other SSDs out there.ionis - Thursday, March 3, 2011 - link
I find that hard to believe, considering they were included in the random read/write graphs at 1/100 or less of the performance of some of the SSDs and the charts weren't scaled horribly.In the sequential reads/writes, they performed at 25%-80% which doesn't through the scale off much at all.
The heavy workload looked to involve a lot of sequential access (installs and downloads). So again, I don't see why they weren't included.
There are also other comments asking for more HDDs in the benches. For people like myself, who didn't start following storage benchmarks until SSDs came out, it's hard to tell what the performance gain is.
ionis - Thursday, March 3, 2011 - link
I find that hard to believe, considering they were included in the random read/write graphs at 1/100 or less of the performance of some of the SSDs and the charts weren't scaled horribly.In the sequential reads/writes, they performed at 25%-80% which doesn't throw the scale off much at all.
The heavy workload looked to involve a lot of sequential access (installs and downloads). So again, I don't see why they weren't included.
There are also other comments asking for more HDDs in the benches. For people like myself, who didn't start following storage benchmarks until SSDs came out, it's hard to tell what the performance gain is.
(sorry if double post, comment didn't seem to show up 1st time)
mateus1987 - Wednesday, March 2, 2011 - link
now you know.http://nzealander.blog.com/files/2011/03/6661.jpg
mateus1987 - Wednesday, March 2, 2011 - link
the satanic Apple logo.http://nzealander.blog.com/files/2011/03/6661.jpg