The Intel SSD 510 Review
by Anand Lal Shimpi on March 2, 2011 1:23 AM EST- Posted in
- IT Computing
- Storage
- SSDs
- Intel
- Intel SSD 510
Intel’s SSD 510 Powered by Marvell
At IDF 2008 Intel presented a session that discussed its SSDs and what made them better than the competition. Allow me to quote, ahem, myself:
“Intel's SSD design attempts to be different in the three key areas that determine SSD performance: Flash, Firmware and Controller.”
and
“The Firmware and Flash-to-SATA controller are both made by Intel, whereas most SSD makers use off the shelf components and FPGAs for their designs. Intel claims that its expertise in microprocessor and platform design allows for much higher levels of performance out of its SSDs.”
Now allow me to contrast what Intel told me at IDF 2008 with the reality of today in 2011.
The “G3” we’ve all been waiting for will still come. That’ll be Intel’s first 25nm SSD and it should carry specs similar to what we already published. However the focus of the drive will be the mainstream. To take care of the high end Intel created a new drive: the Intel SSD 510 (codename Elmcrest) and it uses a Marvell 9174 6Gbps controller.
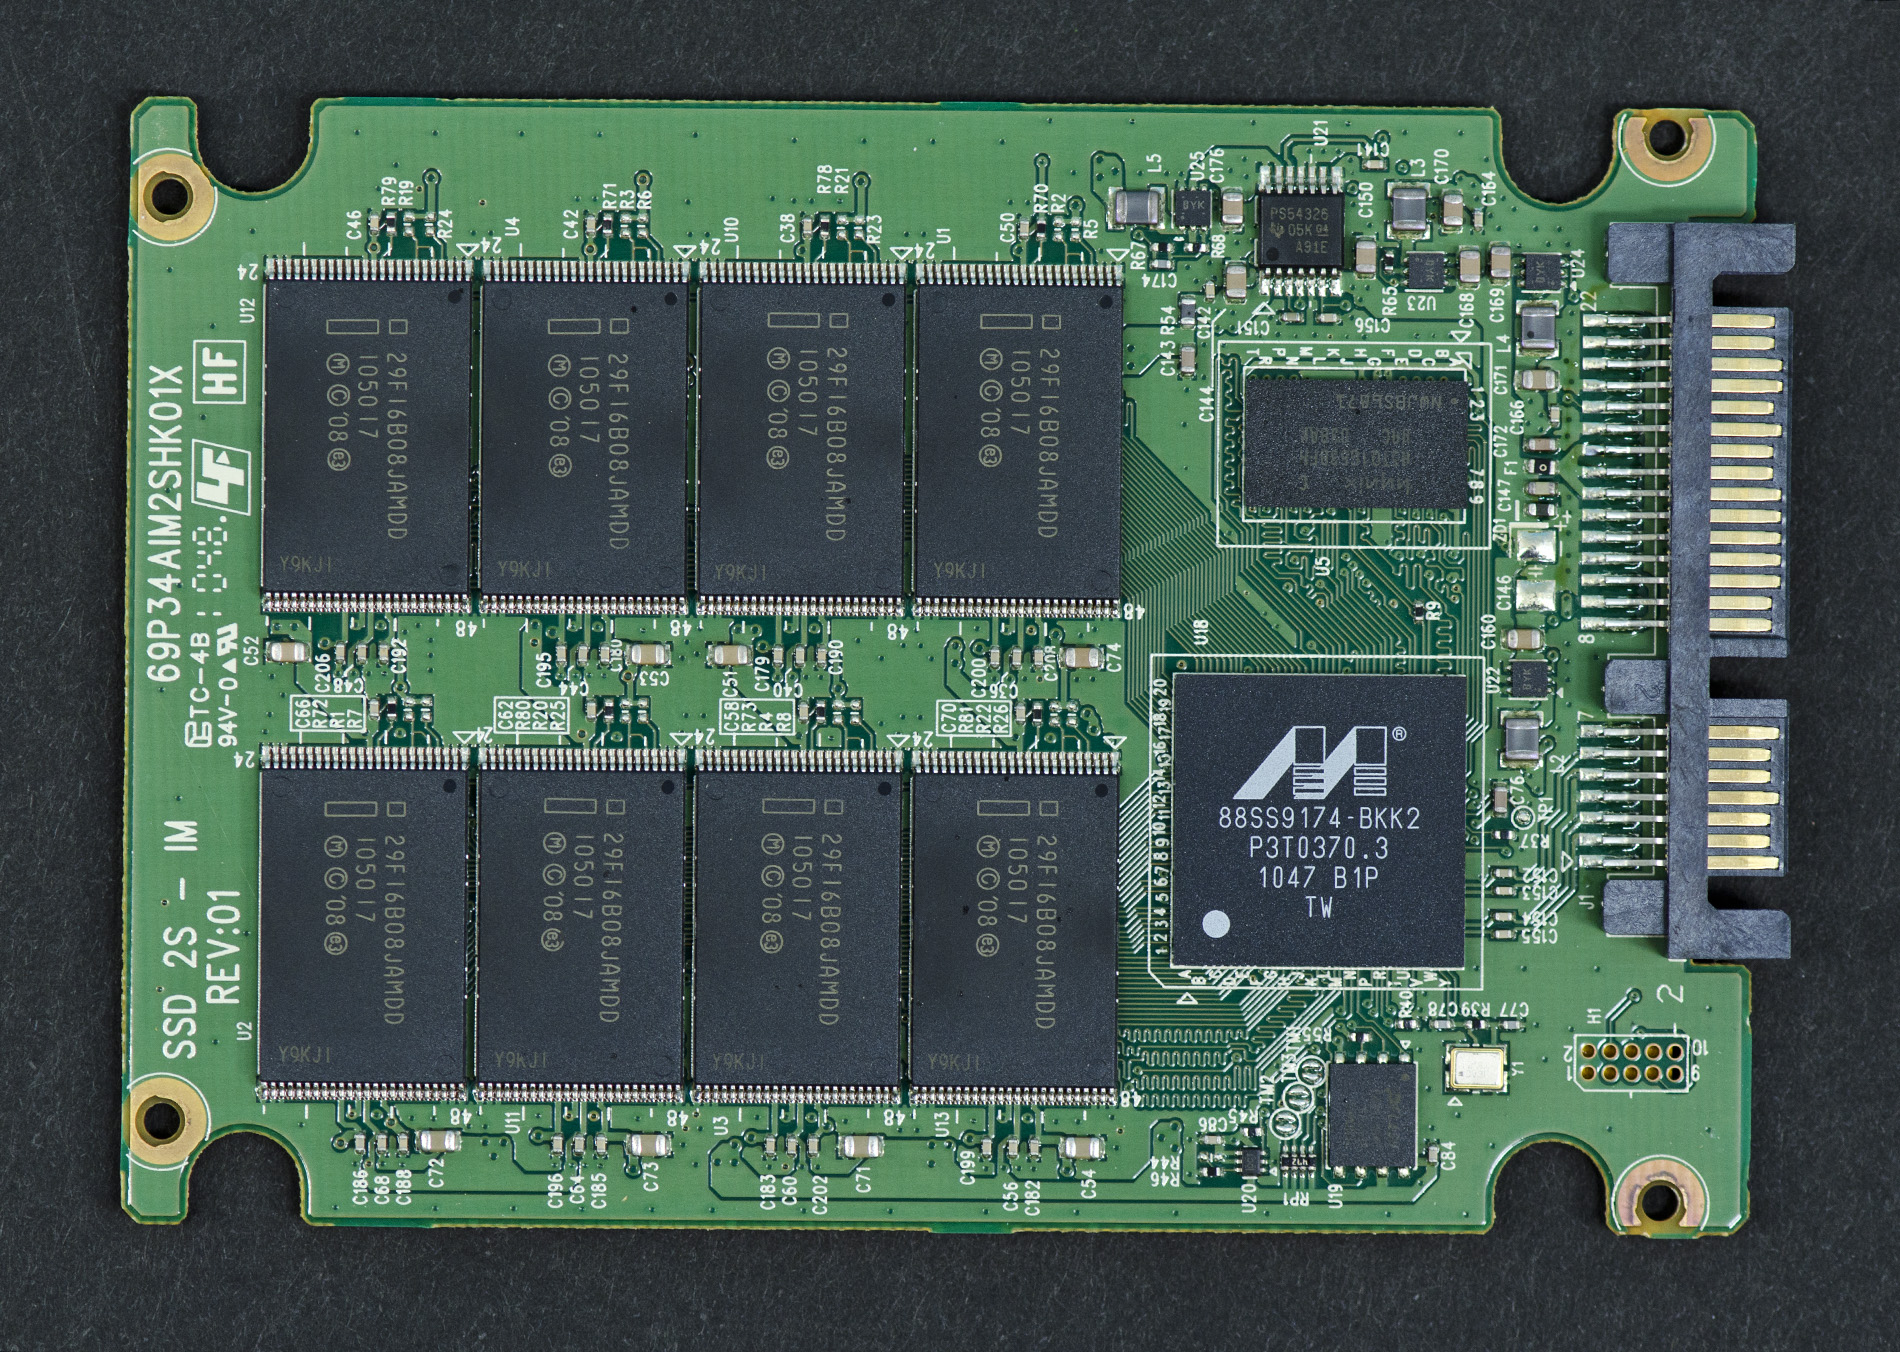
Intel's SSD 510 based on Marvell's 88SS9174 controller
Everyone has access to the same NAND that Intel does, but in the past it was controller microarchitecture and firmware that gave Intel the edge. With the 510, the advantage has been reduced to just firmware.
The Marvell 9174 is the same controller Micron uses in its C400 and the same controller in Corsair’s Performance Series 3 SSDs. In fact, I recently received a Corsair P3. Pop off the lid and you’ll see the very same controller Intel is using in the 510:
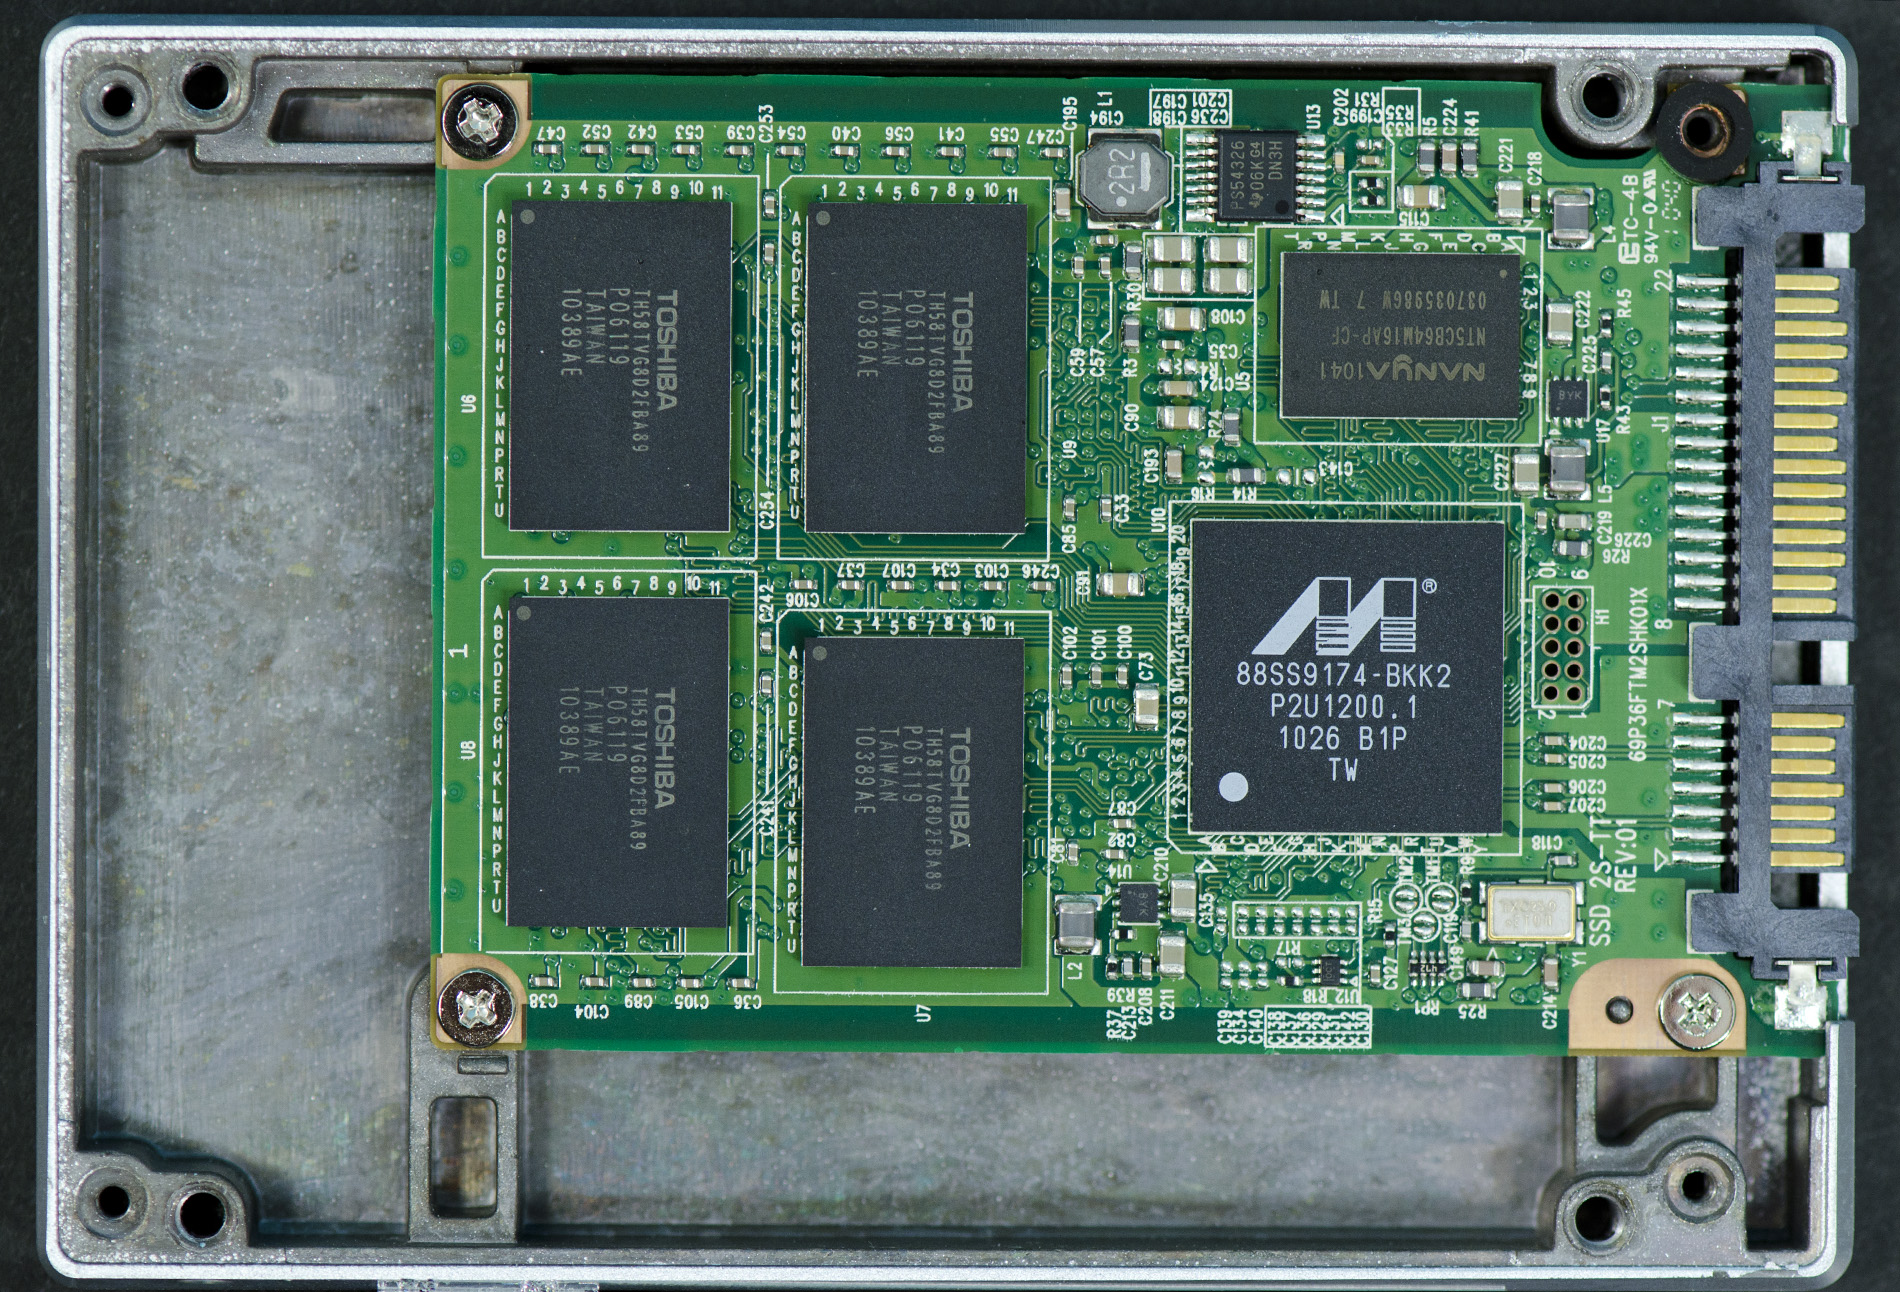
Corsair's P3 SSD, note the controller similarity
Talk to SandForce and they’ll tell you that the controller itself doesn’t matter - it’s the firmware that matters the most. That’s definitely true to an extent, although I can’t help but feel like you need both microarchitecture and firmware to get the absolute best performance.
Although the controller is sourced from Marvell the firmware and validation are entirely Intel’s. As a result you shouldn't expect the 510 to perform identically to other Marvell based drives.
Intel is also quick to point out that despite using a 3rd party controller, the 510 has to go through Intel’s rigorous validation and testing. Reliability and quality should be no different than any other Intel SSD.
I asked Intel if this was a permanent thing - if we should always expect it to license controllers from third parties for its high performance SSDs. Intel responded by saying that the Marvell controller made sense given the hole in its roadmap, however this is not a long term strategy. While we may see more Intel SSDs based on 3rd party controllers, Marvell’s controller is not a permanent resident in Intel’s SSD roadmap - it’s just here on a student visa.
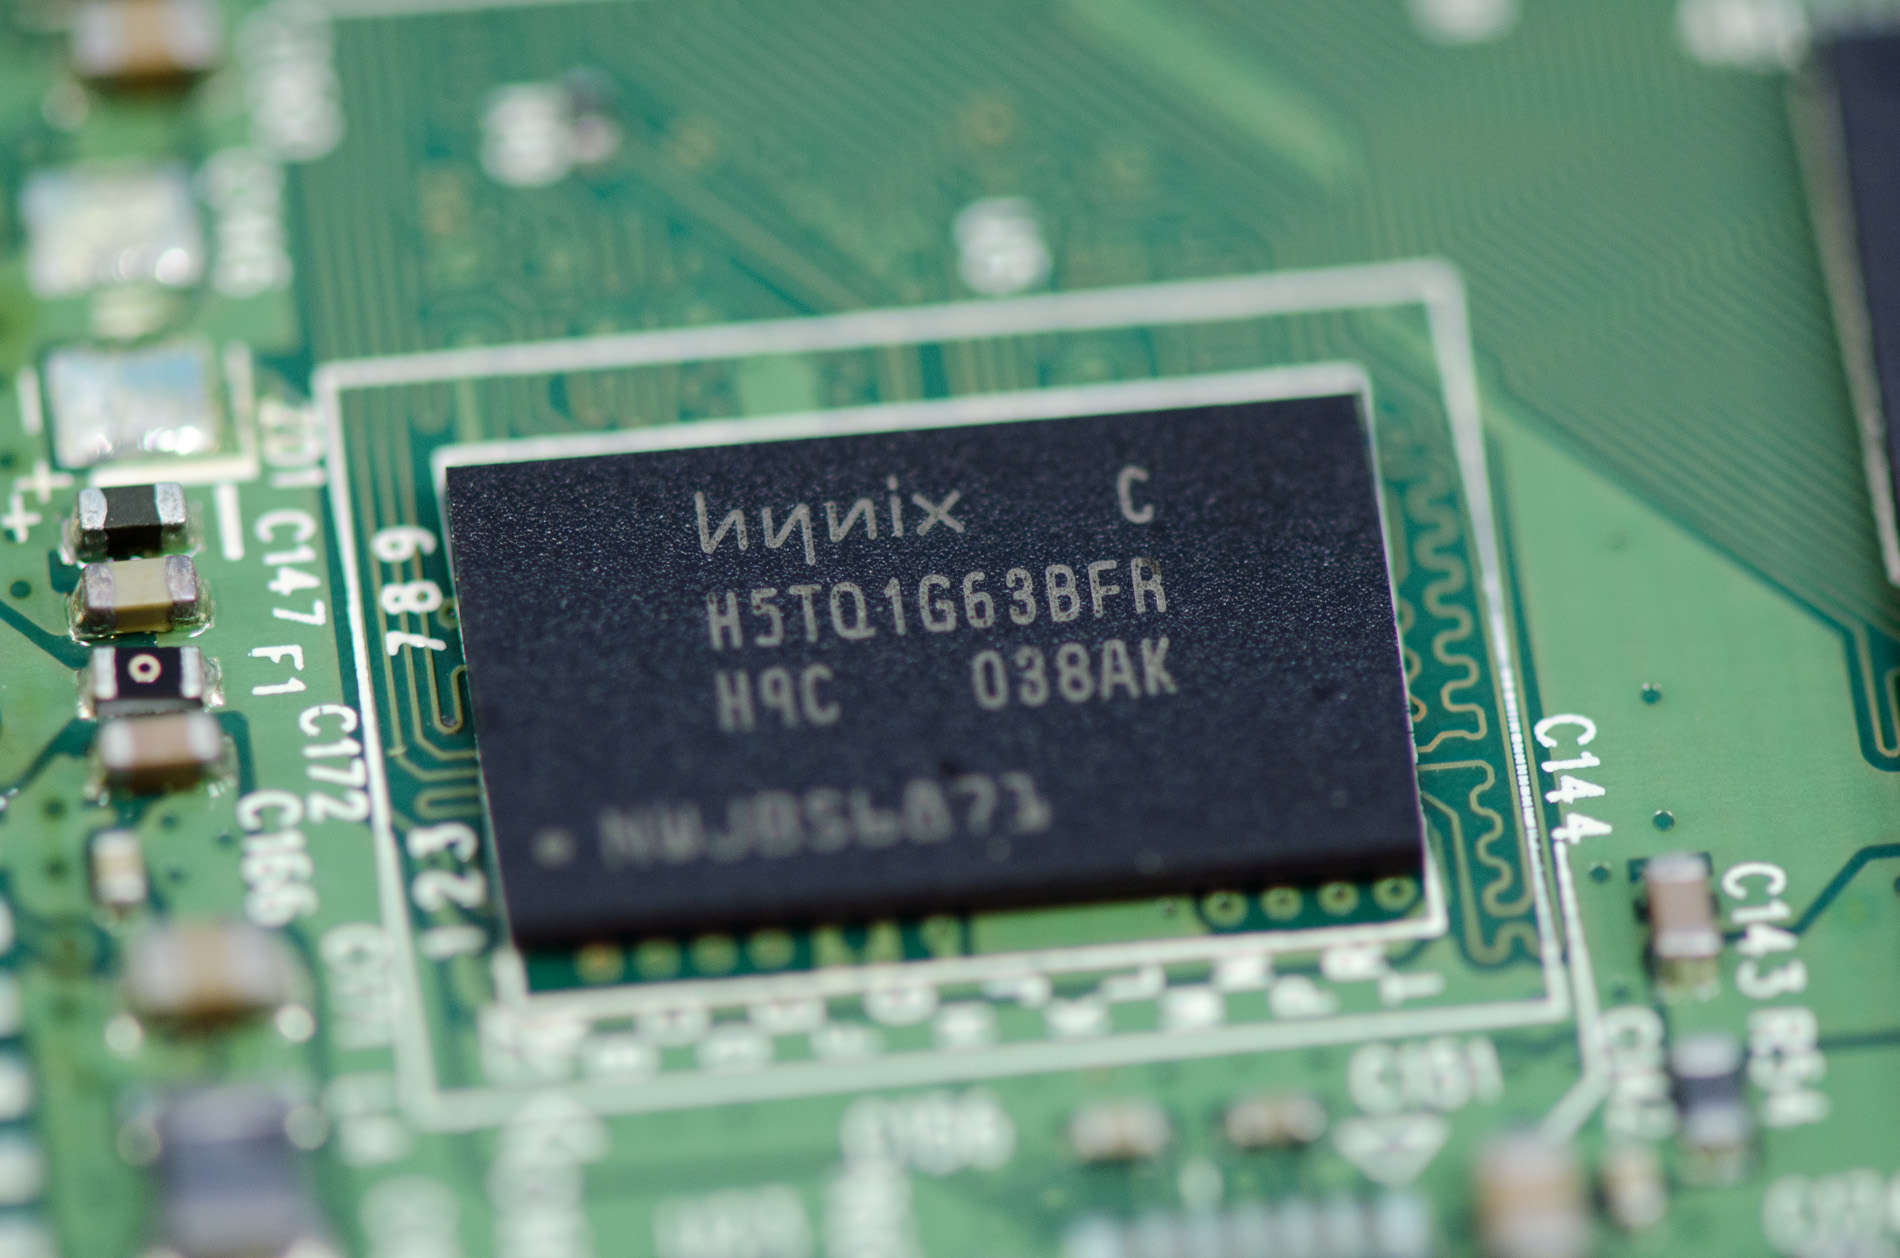
Paired with the Marvell controller is a 128MB Hynix DDR3-1333 SDRAM. This is technically the largest DRAM to appear on an Intel SSD to date. Even the old X25-M G2 only had a 32MB DRAM on board.
The 510 currently only supports 34nm Intel NAND rated at 5,000 p/e cycles. There are two capacities offered: a 120GB and a 250GB. Intel sent us the 250GB version which has 256GB of 34nm Intel NAND spread out across 16 NAND packages. That’s 16GB per package and 4GB per 34nm die.
Remember the GiB/GB conversion math that’s used to mask spare area in SSDs. With 256GiB of NAND on board and 250GB of storage area promised by the drive, there’s actually only 232.8GiB of user addressable space on the 250GB drive. This puts the percentage of spare area at 9%, an increase over the 6.8% spare area common on the X25-M.
The 120GB drive has even more spare area than the 250GB drive. With 128GB of 34nm NAND on board, the 120GB Intel SSD 510 has 111GiB of user addressable space for a total spare area of 12.7%.
Intel’s rated performance for the SSD 510 is as follows:
| Intel SSD Comparison | ||||||
| X25-M G2 160GB | SSD 510 120GB | SSD 510 250GB | ||||
| NAND Capacity | 160GB | 128GB | 256GB | |||
| User Capacity | 149GB | 111GB | 232GB | |||
| Random Read Performance | Up to 35K IOPS | Up to 20K IOPS | Up to 20K IOPS | |||
| Random Write Performance | Up to 8.6K IOPS | Up to 8K IOPS | Up to 8K IOPS | |||
| Sequential Read Performance | Up to 250MB/s | Up to 400MB/s (6Gbps) | Up to 500MB/s (6Gbps) | |||
| Sequential Write Performance | Up to 100MB/s | Up to 210MB/s (6Gbps) | Up to 315MB/s (6Gbps) | |||
| Price | $404 | $284 | $584 | |||
Ironically enough the SSD 510 fixes the X25-M’s poor sequential performance but trades it for lower random performance. On paper the 510’s random performance is decidedly last-generation. And honestly the rated performance of the 120GB isn’t particularly interesting. The 120GB drive will have fewer NAND die available, and SSDs achieve their high performance by striping data requests across as many NAND die as possible - hence the lower performance specs.
Pricing is set at $284 for the 120GB drive and $584 for the 250GB drive. Intel’s SSD 510 is available today and Newegg marks the two up to $315 and $615 respectively.
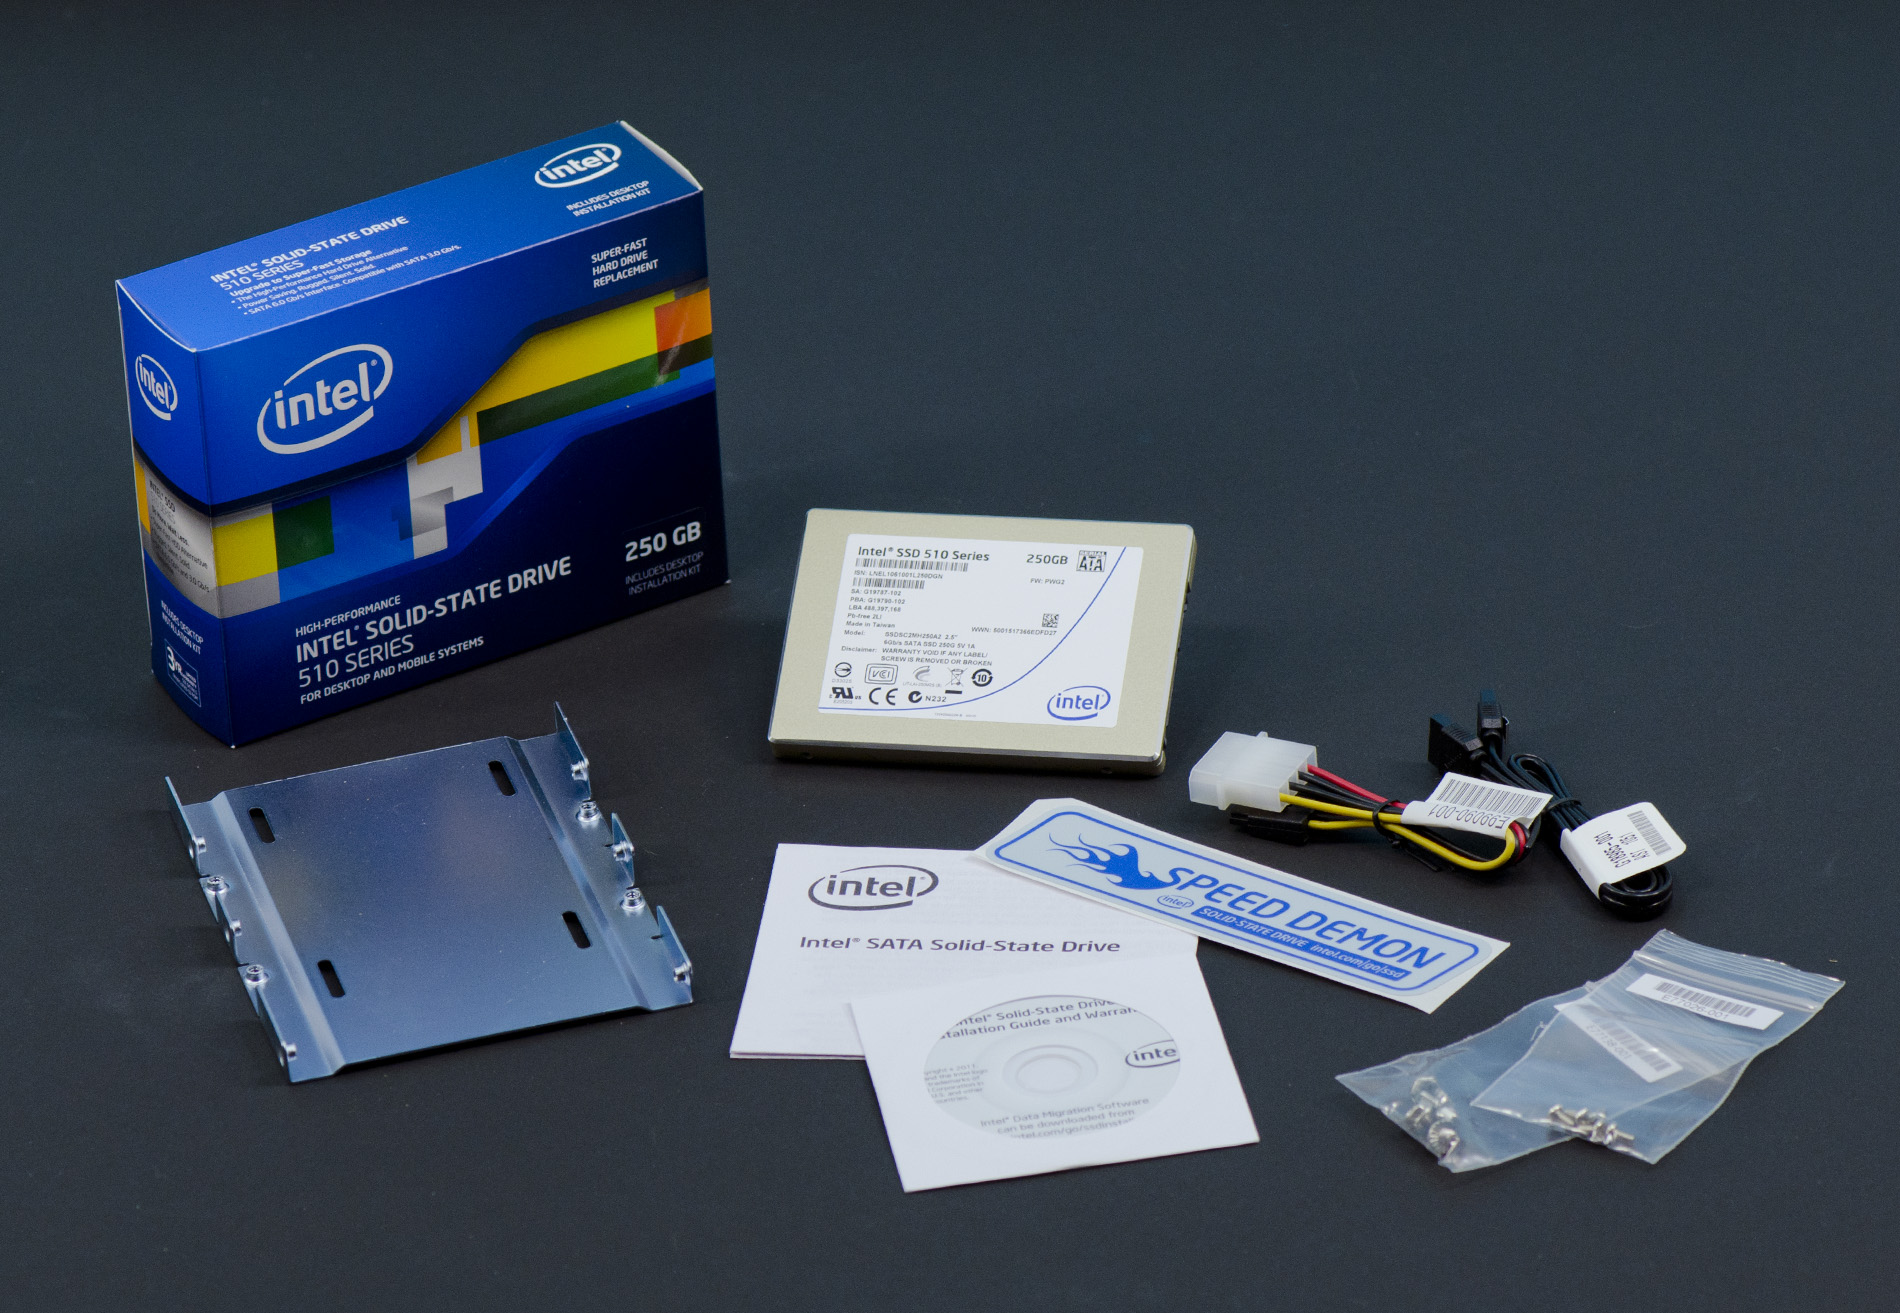
The Bundle
Intel sent over the desktop installation kit bundle for the 510. Included in the box is a 3.5" adapter kit, a 6Gbps SATA cable (3Gbps cables of sufficient quality should work fine though) and a 4-pin molex to SATA power adapter:
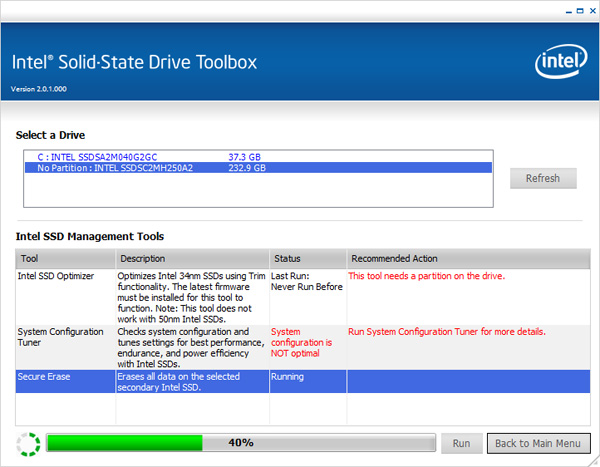
The 510 also works with Intel's SSD Toolbox, which makes tasks like secure erase super simple:


128 Comments
View All Comments
masterkritiker - Wednesday, March 2, 2011 - link
When will we be able to buy $100+ SSDs @ 1TB capacity?gammaray - Wednesday, March 2, 2011 - link
nevertno - Thursday, March 3, 2011 - link
+1Nihility - Thursday, March 3, 2011 - link
At least 4 years.ionis - Wednesday, March 2, 2011 - link
It would be nice if some HDDs were also included in workload benches. They were in the random read/write benches so I don't get why they were left out of the other ones.dagamer34 - Wednesday, March 2, 2011 - link
HDDs aren't included because they'd throw off the scale pretty horribly. The number labeling the performance would be larger than the bar itself compared to all the other SSDs out there.ionis - Thursday, March 3, 2011 - link
I find that hard to believe, considering they were included in the random read/write graphs at 1/100 or less of the performance of some of the SSDs and the charts weren't scaled horribly.In the sequential reads/writes, they performed at 25%-80% which doesn't through the scale off much at all.
The heavy workload looked to involve a lot of sequential access (installs and downloads). So again, I don't see why they weren't included.
There are also other comments asking for more HDDs in the benches. For people like myself, who didn't start following storage benchmarks until SSDs came out, it's hard to tell what the performance gain is.
ionis - Thursday, March 3, 2011 - link
I find that hard to believe, considering they were included in the random read/write graphs at 1/100 or less of the performance of some of the SSDs and the charts weren't scaled horribly.In the sequential reads/writes, they performed at 25%-80% which doesn't throw the scale off much at all.
The heavy workload looked to involve a lot of sequential access (installs and downloads). So again, I don't see why they weren't included.
There are also other comments asking for more HDDs in the benches. For people like myself, who didn't start following storage benchmarks until SSDs came out, it's hard to tell what the performance gain is.
(sorry if double post, comment didn't seem to show up 1st time)
mateus1987 - Wednesday, March 2, 2011 - link
now you know.http://nzealander.blog.com/files/2011/03/6661.jpg
mateus1987 - Wednesday, March 2, 2011 - link
the satanic Apple logo.http://nzealander.blog.com/files/2011/03/6661.jpg