The Intel SSD 510 Review
by Anand Lal Shimpi on March 2, 2011 1:23 AM EST- Posted in
- IT Computing
- Storage
- SSDs
- Intel
- Intel SSD 510
Overall System Performance using PCMark Vantage
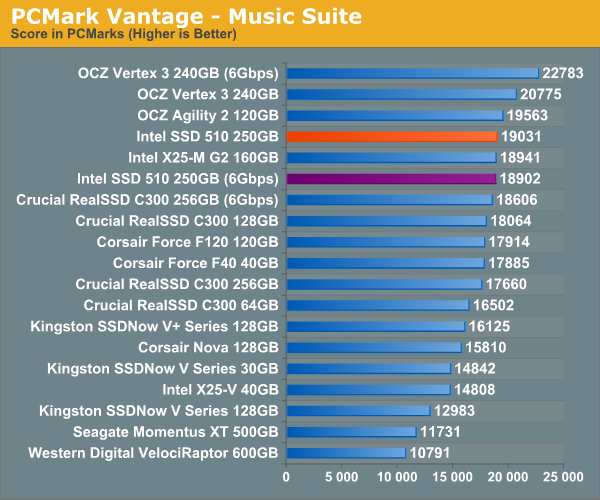
Next up is PCMark Vantage, another system-wide performance suite. For those of you who aren’t familiar with PCMark Vantage, it ends up being the most real-world-like hard drive test I can come up with. It runs things like application launches, file searches, web browsing, contacts searching, video playback, photo editing and other completely mundane but real-world tasks. I’ve described the benchmark in great detail before but if you’d like to read up on what it does in particular, take a look at Futuremark’s whitepaper on the benchmark; it’s not perfect, but it’s good enough to be a member of a comprehensive storage benchmark suite. Any performance impacts here would most likely be reflected in the real world.
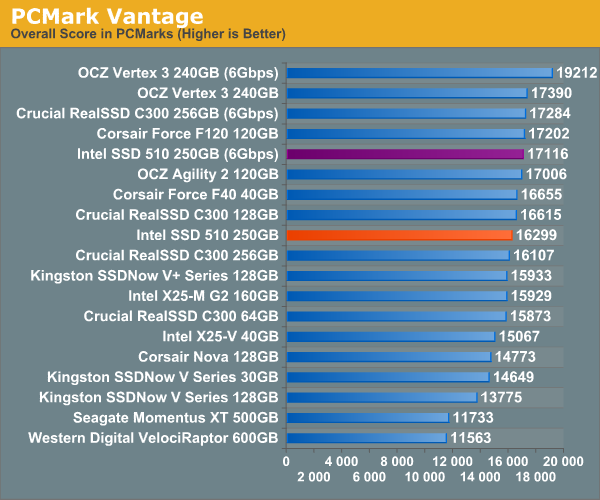
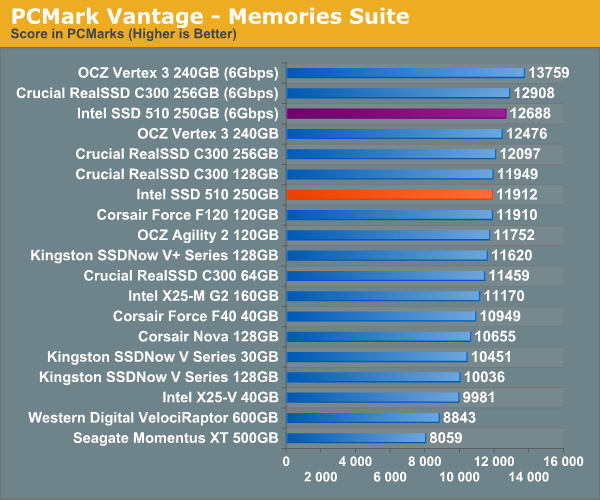
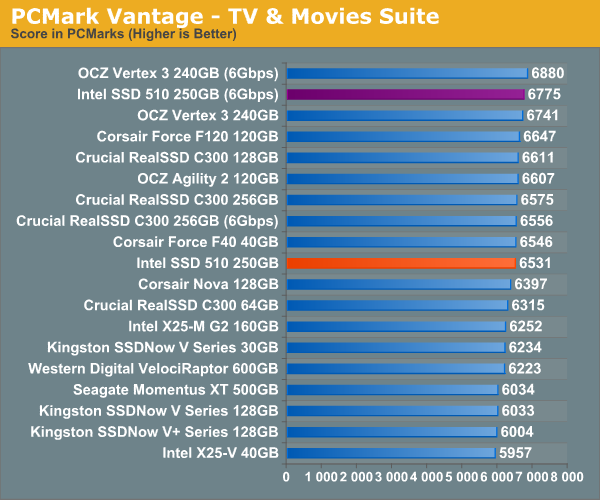
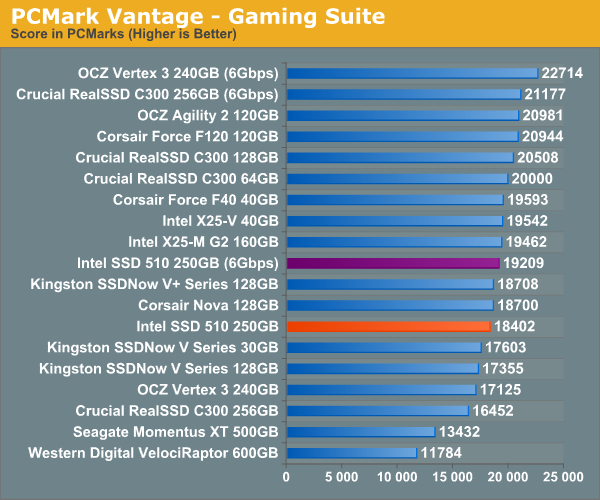
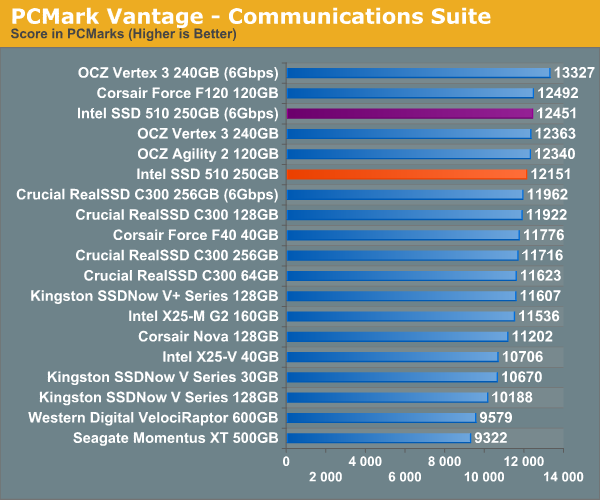
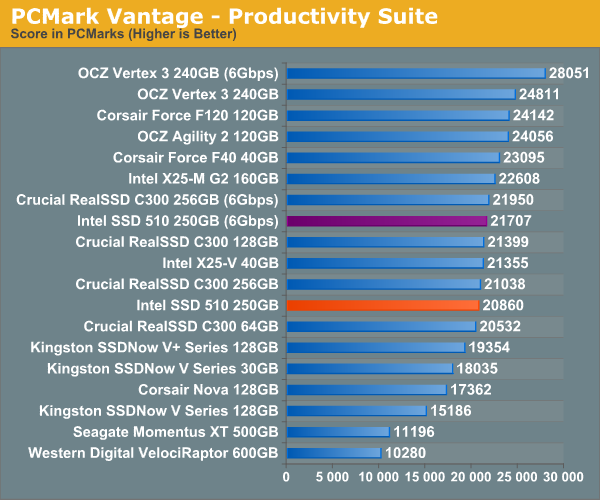
PCMark Vantage doesn't look too good paired with the 510. On a 6Gbps controller the Intel SSD 510 performs in line with the 3Gbps Vertex 3, however the 6Gbps Vertex 3 is untouchable. And over a 3Gbps interface the 510 is no better than a C300.
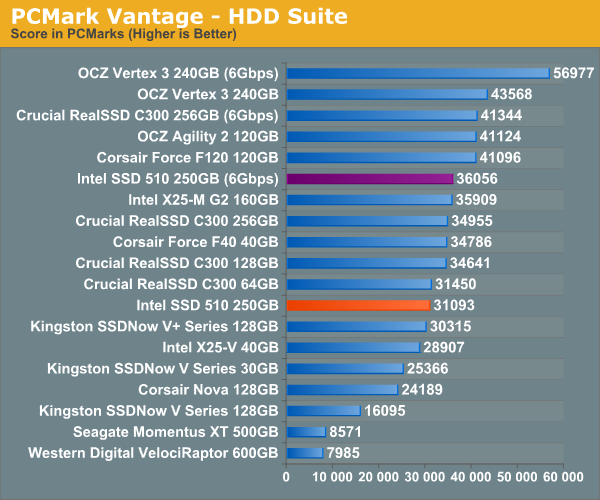
The pure HDD tests (below) are, at best, SF-1200 level. The SF-2200 is untouchable here. Based on what we've seen thus far I'm guessing this has a lot to do with the random read performance of the 510 once more.


128 Comments
View All Comments
masterkritiker - Wednesday, March 2, 2011 - link
When will we be able to buy $100+ SSDs @ 1TB capacity?gammaray - Wednesday, March 2, 2011 - link
nevertno - Thursday, March 3, 2011 - link
+1Nihility - Thursday, March 3, 2011 - link
At least 4 years.ionis - Wednesday, March 2, 2011 - link
It would be nice if some HDDs were also included in workload benches. They were in the random read/write benches so I don't get why they were left out of the other ones.dagamer34 - Wednesday, March 2, 2011 - link
HDDs aren't included because they'd throw off the scale pretty horribly. The number labeling the performance would be larger than the bar itself compared to all the other SSDs out there.ionis - Thursday, March 3, 2011 - link
I find that hard to believe, considering they were included in the random read/write graphs at 1/100 or less of the performance of some of the SSDs and the charts weren't scaled horribly.In the sequential reads/writes, they performed at 25%-80% which doesn't through the scale off much at all.
The heavy workload looked to involve a lot of sequential access (installs and downloads). So again, I don't see why they weren't included.
There are also other comments asking for more HDDs in the benches. For people like myself, who didn't start following storage benchmarks until SSDs came out, it's hard to tell what the performance gain is.
ionis - Thursday, March 3, 2011 - link
I find that hard to believe, considering they were included in the random read/write graphs at 1/100 or less of the performance of some of the SSDs and the charts weren't scaled horribly.In the sequential reads/writes, they performed at 25%-80% which doesn't throw the scale off much at all.
The heavy workload looked to involve a lot of sequential access (installs and downloads). So again, I don't see why they weren't included.
There are also other comments asking for more HDDs in the benches. For people like myself, who didn't start following storage benchmarks until SSDs came out, it's hard to tell what the performance gain is.
(sorry if double post, comment didn't seem to show up 1st time)
mateus1987 - Wednesday, March 2, 2011 - link
now you know.http://nzealander.blog.com/files/2011/03/6661.jpg
mateus1987 - Wednesday, March 2, 2011 - link
the satanic Apple logo.http://nzealander.blog.com/files/2011/03/6661.jpg