The Intel SSD 510 Review
by Anand Lal Shimpi on March 2, 2011 1:23 AM EST- Posted in
- IT Computing
- Storage
- SSDs
- Intel
- Intel SSD 510
AnandTech Storage Bench 2011: Much Heavier
I didn't expect to have to debut this so soon, but I've been working on updated benchmarks for 2011. Last year we introduced our AnandTech Storage Bench, a suite of benchmarks that took traces of real OS/application usage and played them back in a repeatable manner. I assembled the traces myself out of frustration with the majority of what we have today in terms of SSD benchmarks.
Although the AnandTech Storage Bench tests did a good job of characterizing SSD performance, they weren't stressful enough. All of the tests performed less than 10GB of reads/writes and typically involved only 4GB of writes specifically. That's not even enough exceed the spare area on most SSDs. Most canned SSD benchmarks don't even come close to writing a single gigabyte of data, but that doesn't mean that simply writing 4GB is acceptable.
Originally I kept the benchmarks short enough that they wouldn't be a burden to run (~30 minutes) but long enough that they were representative of what a power user might do with their system.
Not too long ago I tweeted that I had created what I referred to as the Mother of All SSD Benchmarks (MOASB). Rather than only writing 4GB of data to the drive, this benchmark writes 106.32GB. It's the load you'd put on a drive after nearly two weeks of constant usage. And it takes a *long* time to run.
I'll be sharing the full details of the benchmark in some upcoming SSD articles but here are some details:
1) The MOASB, officially called AnandTech Storage Bench 2011 - Heavy Workload, mainly focuses on the times when your I/O activity is the highest. There is a lot of downloading and application installing that happens during the course of this test. My thinking was that it's during application installs, file copies, downloading and multitasking with all of this that you can really notice performance differences between drives.
2) I tried to cover as many bases as possible with the software I incorporated into this test. There's a lot of photo editing in Photoshop, HTML editing in Dreamweaver, web browsing, game playing/level loading (Starcraft II & WoW are both a part of the test) as well as general use stuff (application installing, virus scanning). I included a large amount of email downloading, document creation and editing as well. To top it all off I even use Visual Studio 2008 to build Chromium during the test.
Many of you have asked for a better way to really characterize performance. Simply looking at IOPS doesn't really say much. As a result I'm going to be presenting Storage Bench 2011 data in a slightly different way. We'll have performance represented as Average MB/s, with higher numbers being better. At the same time I'll be reporting how long the SSD was busy while running this test. These disk busy graphs will show you exactly how much time was shaved off by using a faster drive vs. a slower one during the course of this test. Finally, I will also break out performance into reads, writes and combined. The reason I do this is to help balance out the fact that this test is unusually write intensive, which can often hide the benefits of a drive with good read performance.
There's also a new light workload for 2011. This is a far more reasonable, typical every day use case benchmark. Lots of web browsing, photo editing (but with a greater focus on photo consumption), video playback as well as some application installs and gaming. This test isn't nearly as write intensive as the MOASB but it's still multiple times more write intensive than what we were running last year.
As always I don't believe that these two benchmarks alone are enough to characterize the performance of a drive, but hopefully along with the rest of our tests they will help provide a better idea.
The testbed for Storage Bench 2011 has changed as well. We're now using a Sandy Bridge platform with full 6Gbps support for these tests. All of the older tests are still run on our X58 platform.
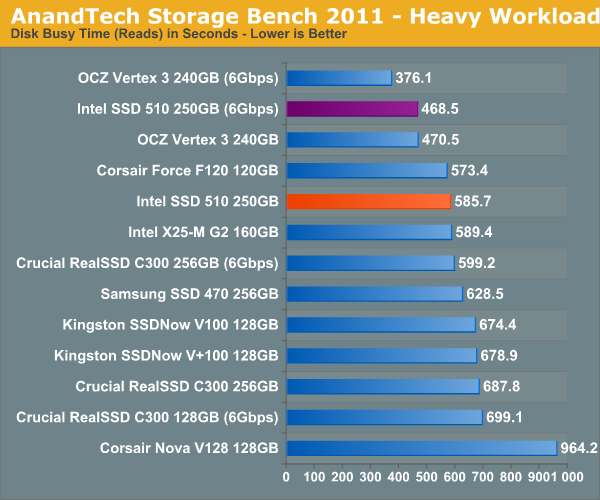
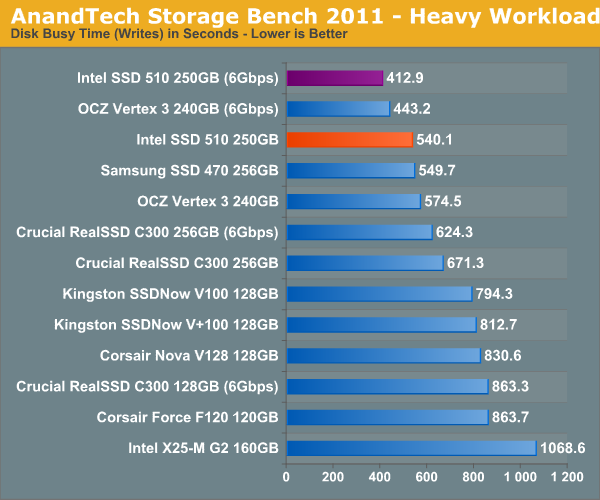
AnandTech Storage Bench 2011 - Heavy Workload
We'll start out by looking at average data rate throughout our new heavy workload test:
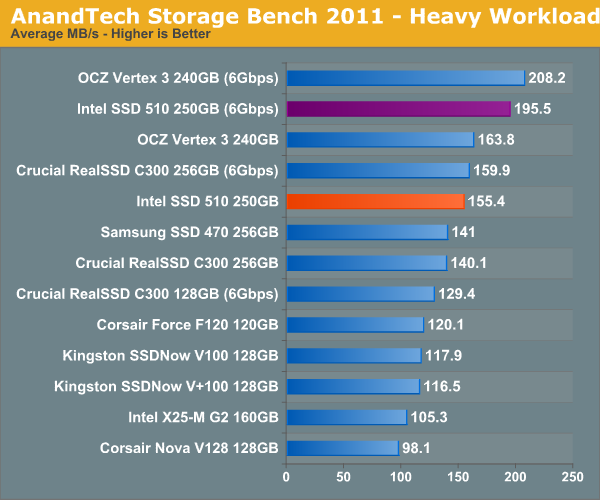
There's simply no dethroning the Vertex 3, but Intel's SSD 510 does come dangerously close. Over a 6Gbps interface the 510 delivers 93% of the performance of the Vertex 3. Over a 3Gbps interface the gap narrows to a meager 5.2%.
The breakdown of reads vs. writes tells us more of what's going on:
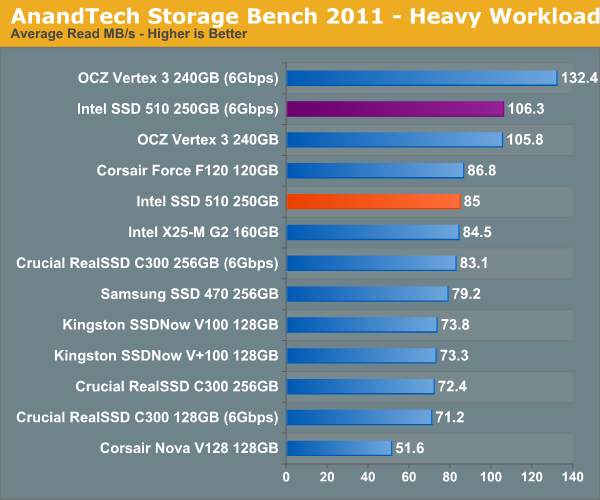
The Vertex 3 is nearly 25% faster than the 510 if we just isolate the reads conducted by our benchmark. Remember the poor random read performance? I suspect that's at play here. The Intel SSD 510 on a 6Gbps interface is about the speed of the Vertex 3 on a 3Gbps port.
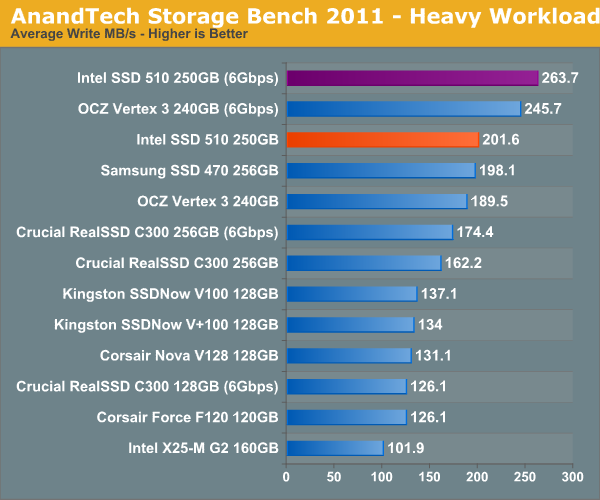
Ah ha! This is where the picture shifts. Our heavy workload does have a significant amount of incompressible writes which significantly reduce the performance of the Vertex 3. The V3 loses enough ground that the 510 is 7% faster in writes during our benchmark.
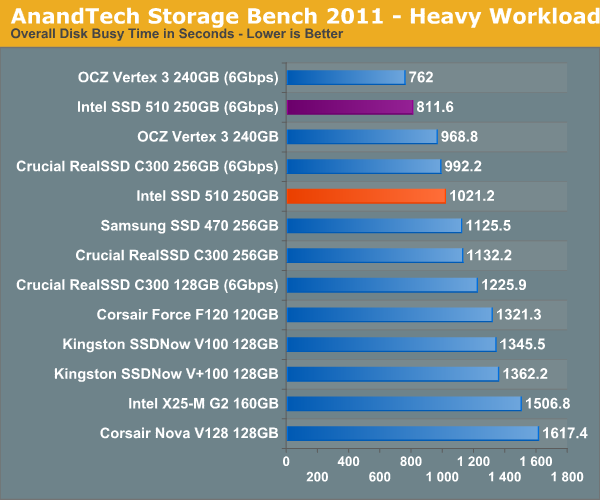
The next three charts just represent the same data, but in a different manner. Instead of looking at average data rate, we're looking at how long the disk was busy for during this entire test. Note that disk busy time excludes any and all idles, this is just how long the SSD was busy doing something:


128 Comments
View All Comments
7Enigma - Wednesday, March 2, 2011 - link
Like Anand I'm shocked Intel went this route. After touting the random read/write so heavily (and for good reason) they pull this stunt and look horrible. I'm an owner of an 80gig G2 and love it but have been in the process of justifying an upgrade so I can put the 80gig in my laptop. I'm willing to sacrifice a bit of sequential performance (just like I did with the G2 over other competitors), but this is a complete step backwards.And remember the review unit was the larger drive. Put the 120gig version in those benchmarks and the critical numbers that are so low to start with are only going to become much worse. Just like all of the previous releases due to high cost the majority of people will be purchasing the smaller-sized drives (most people bought Intel 80gig when 160gig was out, etc.).
When you are competing on firmware only, and that firmware is not the best to begin with (in comparison to Sandforce), you have to be perfect, and in this case Intel just didn't produce.
Very disappointed indeed.
Concillian - Wednesday, March 2, 2011 - link
"After touting the random read/write so heavily (and for good reason) they pull this stunt and look horrible."They don't look horrible, they are 2nd or 1st in most of the real world tests, Improving on the G2 performance.
Random performance is lower, but the real world tests demonstrate that random performance has reached a point where it is "enough" for typical workloads.
semo - Wednesday, March 2, 2011 - link
Whose real world are we talking about here? Average Joe "real world", mainstream "real world", enthusiast "real world"... you get the idea.As an average user (net browsing, office apps, flash gaming, etc...) this sort of performance is great. However, the same user would benefit just as much from a much cheaper 60GB SSD. The 510 is neither cheap overall or in $/GB sense. My "real world" is using VMs and lot's of tests involving high QDs and IOPS so this drive is not for me... At that price, capacity and performance, I don't know who this drive is for.
TEAMSWITCHER - Wednesday, March 2, 2011 - link
It's a bit surprising that the Crucial C300 (on the 6 GB/s) interface did so well in the real world benchmarks. This drive is a year old and still competitive. Newegg had them on sale a couple weeks ago for only $480.00. Which is a bargain compared to the $615.00 for the Intel 510. This is an interesting technology to watch, with lots of plot twists and upsets. I can't wait to see the crucial M4.Lonesloane - Wednesday, March 2, 2011 - link
I see the price point of the new Intel 510 drives extremely critical. Intel have always charged more than the competition and got away with it due to the fact that on the other hand there was the good quality, compatibility and reliablity of their SSD products.Now it seems like a clear win for Sandforce, especially if we take the superior write amplification of the sandforce controller, which is a big advantage regarding the reduced write cycles of the new 25nm NAND.
Shadowmaster625 - Wednesday, March 2, 2011 - link
You have to tell them to stop sending you Ferraris because no one buys Ferraris. The 120GB versions of both the OCZ and Intel drives are much more relevant, and we dont have the foggiest clue how they line up. And even if we did, we would not know how the 40/60/80 GB versions stack up against each other. I am currently shopping for a 40-60GB SSD and I cannot even to this day get a clear answer on which product is better (performance per dollar). And all of these drives have been out for at least year....7Enigma - Wednesday, March 2, 2011 - link
Exactly. I posted above about this and it will seriously hurt Intel as the poor random read/write will only become worse.Concillian - Wednesday, March 2, 2011 - link
"I am currently shopping for a 40-60GB SSD and I cannot even to this day get a clear answer on which product is better (performance per dollar). And all of these drives have been out for at least year.... "This is a concern and all you really need to know is how they reduce capacity.
They can do it by reducing the number of chips (usually will see a performance hit)
or
They can do it by using the same number of chips, but each stores less (usually will perform about the same)
When you look at the OCZ 25nm "debacle" it was this very decision that created the issue. The 25nm flash itself was not the problem (even though that got a fair bit of the blame)... it was how they implemented it. They used half the 25nm higher density chips in the drives, reducing performance. This also meant reserving one block for over-provision meant it was larger in size, so that ate into the usable capacity. The solution still uses 25nm chips, but they're the same number of chips as 34nm, so they perform at about the same level.
There probably needs to be a chart at the beginning like the video card articles showing details for each drive. It would clear up any issues, as well as something that can be referred to in the future. I refer to the old video card reviews when looking for things like ROP / texture counts, memory bandwidth, speeds, etc... because those charts have really useful information in them.
jnmfox - Wednesday, March 2, 2011 - link
+1We need a round-up of OS boot drives (40/60/80 GB). I love my 80GB G2 but I’m not interested in paying more than $200, hopefully less, for an SSD.
Stargrazer - Wednesday, March 2, 2011 - link
I too would love to see the numbers for the 128(-ish) GB versions.