The Intel SSD 510 Review
by Anand Lal Shimpi on March 2, 2011 1:23 AM EST- Posted in
- IT Computing
- Storage
- SSDs
- Intel
- Intel SSD 510
AnandTech Storage Bench 2010
To keep things consistent we've also included our older Storage Bench. Note that the old storage test system doesn't have a SATA 6Gbps controller, so we only have one result for the 6Gbps drives.
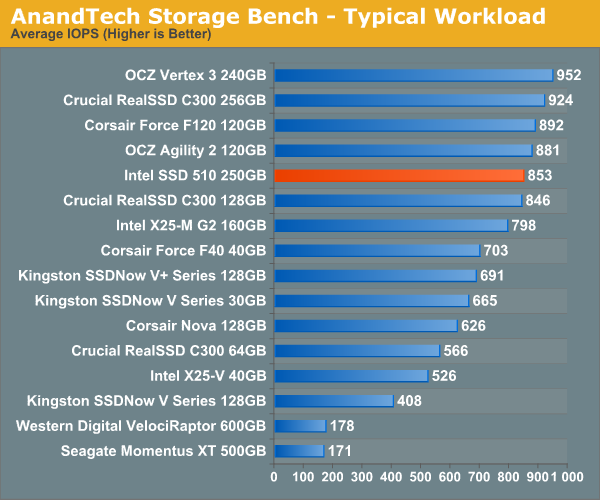
The first in our benchmark suite is a light/typical usage case. The Windows 7 system is loaded with Firefox, Office 2007 and Adobe Reader among other applications. With Firefox we browse web pages like Facebook, AnandTech, Digg and other sites. Outlook is also running and we use it to check emails, create and send a message with a PDF attachment. Adobe Reader is used to view some PDFs. Excel 2007 is used to create a spreadsheet, graphs and save the document. The same goes for Word 2007. We open and step through a presentation in PowerPoint 2007 received as an email attachment before saving it to the desktop. Finally we watch a bit of a Firefly episode in Windows Media Player 11.
There’s some level of multitasking going on here but it’s not unreasonable by any means. Generally the application tasks proceed linearly, with the exception of things like web browsing which may happen in between one of the other tasks.
The recording is played back on all of our drives here today. Remember that we’re isolating disk performance, all we’re doing is playing back every single disk access that happened in that ~5 minute period of usage. The light workload is composed of 37,501 reads and 20,268 writes. Over 30% of the IOs are 4KB, 11% are 16KB, 22% are 32KB and approximately 13% are 64KB in size. Less than 30% of the operations are absolutely sequential in nature. Average queue depth is 6.09 IOs.
The performance results are reported in average I/O Operations per Second (IOPS):
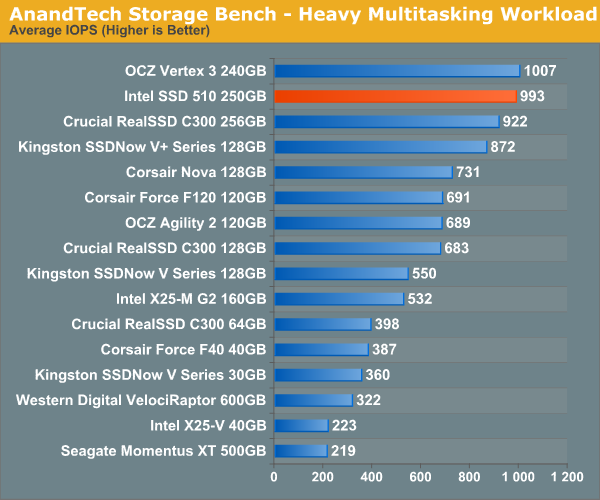
If there’s a light usage case there’s bound to be a heavy one. In this test we have Microsoft Security Essentials running in the background with real time virus scanning enabled. We also perform a quick scan in the middle of the test. Firefox, Outlook, Excel, Word and Powerpoint are all used the same as they were in the light test. We add Photoshop CS4 to the mix, opening a bunch of 12MP images, editing them, then saving them as highly compressed JPGs for web publishing. Windows 7’s picture viewer is used to view a bunch of pictures on the hard drive. We use 7-zip to create and extract .7z archives. Downloading is also prominently featured in our heavy test; we download large files from the Internet during portions of the benchmark, as well as use uTorrent to grab a couple of torrents. Some of the applications in use are installed during the benchmark, Windows updates are also installed. Towards the end of the test we launch World of Warcraft, play for a few minutes, then delete the folder. This test also takes into account all of the disk accesses that happen while the OS is booting.
The benchmark is 22 minutes long and it consists of 128,895 read operations and 72,411 write operations. Roughly 44% of all IOs were sequential. Approximately 30% of all accesses were 4KB in size, 12% were 16KB in size, 14% were 32KB and 20% were 64KB. Average queue depth was 3.59.
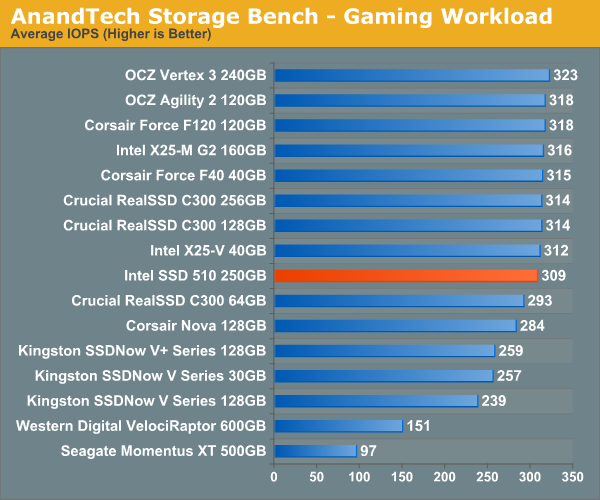
The gaming workload is made up of 75,206 read operations and only 4,592 write operations. Only 20% of the accesses are 4KB in size, nearly 40% are 64KB and 20% are 32KB. A whopping 69% of the IOs are sequential, meaning this is predominantly a sequential read benchmark. The average queue depth is 7.76 IOs.


128 Comments
View All Comments
Squuiid - Friday, March 4, 2011 - link
+1They were the 1st of this next gen to be available, yet NOBODY has reviewed them.
Based on the 2nd Gen Marvel controller I believe, a' la C400.
Luke212 - Friday, March 4, 2011 - link
Anand,I am looking to implement SSDs in Application servers and I need to know how they go in Raid 1 over time. Noone seems to test this! So I am stuck with magnetic drives!!
sean.crees - Friday, March 11, 2011 - link
Anyone else notice the Samsung 470 near or at the top of most benchmarks on a 3gb controller? Is this the SSD in current Macbook Pro's? I havn't seen a review posted to Anandtech about this specific device.daidaloss - Tuesday, March 15, 2011 - link
I'm curious as to how does this SSD drive stacks up when compared to this unit SATA2 DDR2 HyperDrive5 from http://www.hyperossystems.co.uk/.Maybe sometime in the future, Anand will consider this RAM drive.
tygrus - Wednesday, May 11, 2011 - link
Not specific to Intel 510 SSD:Sequential performance after several full disk GB rewrites ?
The LBA remapping for wear levelling must make more of the disk look random (not sequential) after every block has been re-written several times. It's a torture test to see how it can handle reading large files that have been spread over several non-sequential NAND blocks. Or does it not matter as much because the controller can optimise access to several NAND dies at once? Does it only remap 512KB at a time or does the 512KB blocks have non-sequential 4KB LBA's written to them?
Does SSD performance approach random R/W performance after long term heavy use ?
gaffe - Tuesday, October 11, 2011 - link
Just an anonymous tip. I happen to know this data is wildly inaccurate because my friend is a reliability engineer at a major company.WHY DON'T YOU DO A SMALL RELIABILITY TEST OF YOUR OWN TO SEE FOR YOURSELF HOW UNLIKELY IT IS THAT THIS DATA IS ACCURATE.
It seems you have tested probably 20 SSDs for your reviews. So, how many of them have failed on you during testing? How many during the course of the past 3 years? What's the failure rate average across all manufacturers?
Even though manufacturers probably send you their best tested units for review, and your sample size is small, etc. I am willing to bet you REAL MONEY that the failure rate will be more than 3% even in a sample size of just 20.
How about we buy 20 SSDs today and in 3 years see who is right, loser buys em all, winner gets em (you can keep the failed ones)?
Any takers?
gaffe - Tuesday, October 11, 2011 - link
Oh and P.S.You forgot to mention above that failure rates are generally PER YEAR. So that's a 3% chance it fails EACH YEAR. And it's still wrong by double or triple (it's closer to 9%).
gaffe - Tuesday, October 11, 2011 - link
Sorry to keep piling on, but it bothers me so much that this inaccurate data is out there and people are believing this that I also want to mention this data does not even say which models were tested. This is probably all enterprise grade drives that does not even apply to consumers that are reading this article, and, as I said above, it's STILL INACCURATE!