OCZ Vertex 3 Preview: Faster and Cheaper than the Vertex 3 Pro
by Anand Lal Shimpi on February 24, 2011 9:02 AM ESTAnandTech Storage Bench 2010
To keep things consistent we've also included our older Storage Bench. Note that the old storage test system doesn't have a SATA 6Gbps controller, so we only have one result for the 6Gbps drives.
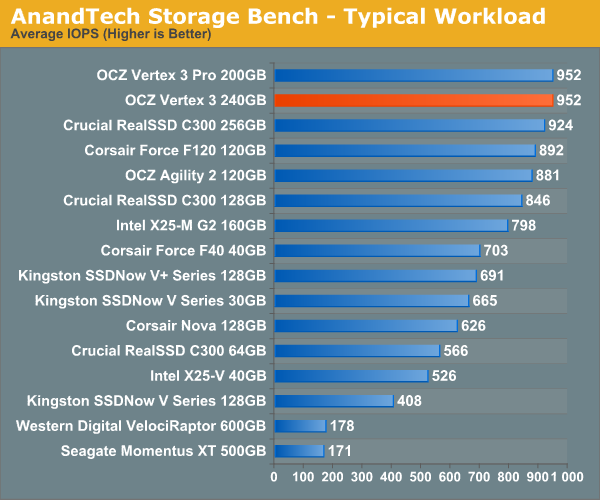
The first in our benchmark suite is a light/typical usage case. The Windows 7 system is loaded with Firefox, Office 2007 and Adobe Reader among other applications. With Firefox we browse web pages like Facebook, AnandTech, Digg and other sites. Outlook is also running and we use it to check emails, create and send a message with a PDF attachment. Adobe Reader is used to view some PDFs. Excel 2007 is used to create a spreadsheet, graphs and save the document. The same goes for Word 2007. We open and step through a presentation in PowerPoint 2007 received as an email attachment before saving it to the desktop. Finally we watch a bit of a Firefly episode in Windows Media Player 11.
There’s some level of multitasking going on here but it’s not unreasonable by any means. Generally the application tasks proceed linearly, with the exception of things like web browsing which may happen in between one of the other tasks.
The recording is played back on all of our drives here today. Remember that we’re isolating disk performance, all we’re doing is playing back every single disk access that happened in that ~5 minute period of usage. The light workload is composed of 37,501 reads and 20,268 writes. Over 30% of the IOs are 4KB, 11% are 16KB, 22% are 32KB and approximately 13% are 64KB in size. Less than 30% of the operations are absolutely sequential in nature. Average queue depth is 6.09 IOs.
The performance results are reported in average I/O Operations per Second (IOPS):
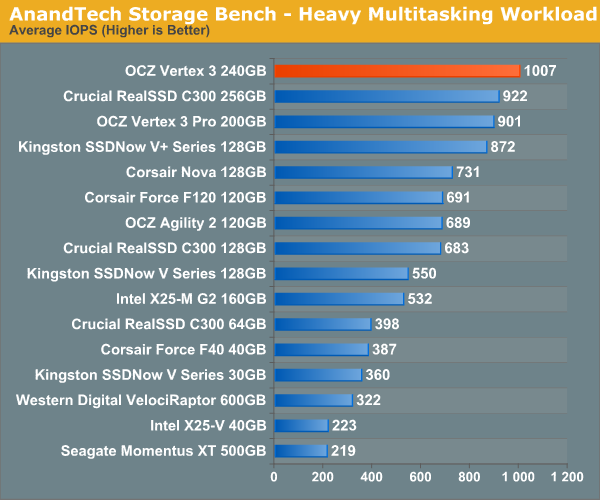
If there’s a light usage case there’s bound to be a heavy one. In this test we have Microsoft Security Essentials running in the background with real time virus scanning enabled. We also perform a quick scan in the middle of the test. Firefox, Outlook, Excel, Word and Powerpoint are all used the same as they were in the light test. We add Photoshop CS4 to the mix, opening a bunch of 12MP images, editing them, then saving them as highly compressed JPGs for web publishing. Windows 7’s picture viewer is used to view a bunch of pictures on the hard drive. We use 7-zip to create and extract .7z archives. Downloading is also prominently featured in our heavy test; we download large files from the Internet during portions of the benchmark, as well as use uTorrent to grab a couple of torrents. Some of the applications in use are installed during the benchmark, Windows updates are also installed. Towards the end of the test we launch World of Warcraft, play for a few minutes, then delete the folder. This test also takes into account all of the disk accesses that happen while the OS is booting.
The benchmark is 22 minutes long and it consists of 128,895 read operations and 72,411 write operations. Roughly 44% of all IOs were sequential. Approximately 30% of all accesses were 4KB in size, 12% were 16KB in size, 14% were 32KB and 20% were 64KB. Average queue depth was 3.59.
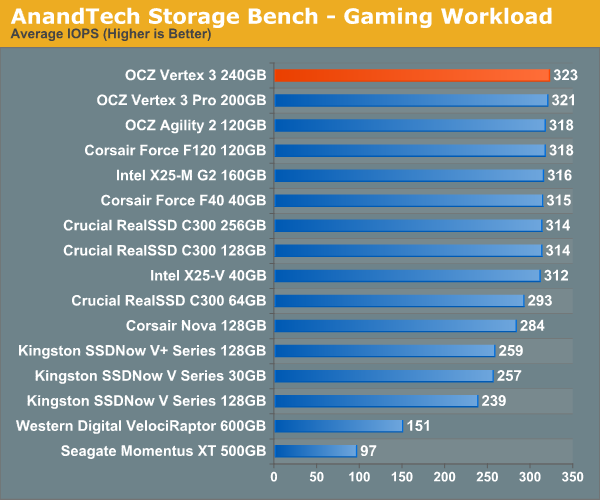
The gaming workload is made up of 75,206 read operations and only 4,592 write operations. Only 20% of the accesses are 4KB in size, nearly 40% are 64KB and 20% are 32KB. A whopping 69% of the IOs are sequential, meaning this is predominantly a sequential read benchmark. The average queue depth is 7.76 IOs.


85 Comments
View All Comments
FunBunny2 - Friday, February 25, 2011 - link
If you're running a really relational database, then random performance is what matters.iwod - Friday, February 25, 2011 - link
Yes, but 99% of Normal World Users dont run Relational DB. And those who ran the DB would properly search for faster Random I/O instead.jimhsu - Friday, February 25, 2011 - link
It ... depends. Real world performance is really complicated:1. You can have any combination of read or writes, sequential or random, going on at once.
2. You have both synchronous IO (this read must be done before that read) and asynchronous IO (this reads all need to be executed, but in whatever order).
3. You have other bottlenecks coming into play - CPU, memory, GPU, ...
All the basic metrics (seq read/write, random read/write) are important. As well as performance with mixed read/write workloads (this is in fact the most difficult aspect to bench). Hard drives have been around for decades, so we have well-established metrics for determining performance. Flash SSDs have been around for less than 10, and in the consumer market, less than 3 years.
iwod - Friday, February 25, 2011 - link
Yes Performance is Complicated. But it doesn't matter in this context. We are trying to find the bottleneck and fastest Storage Hardware within today's Applications. And the Anandtech Bechmarks, is basically just a batch script that execute common task that we do. Time and Average it as Scores.Time and Time again i have asked why some brand controller, labeled as "crap" by most of us, continuously to perform extremely well, and in many cases even better then Sandforce on Anand Real World Benchmarks ( Read Toshiba Controller in Kingston V+ aka Apple's MBA SSD)
Chaser - Friday, February 25, 2011 - link
As SSDs become more common and second/third generations of models are starting to appear graph bars showing numerical values are beginning to got lost in haze. How would a "PC Mark Vantage score" difference of 3 points equate to an improved and noticable user experience? So while pages of "faster, higher" values might look appealing I am more lost now than anything else.For me, I enjoy reading conclusions similar to GPU results and comparisons. Such as, "If you have a Sandforce 1200 drive upgrading to this next generation wouldn't result in much or more of a noticable change on the average desktop enthusiast or gaming computer.
iwod - Friday, February 25, 2011 - link
The difference of 3 Points will be the same. Because it is within Margin or Error.Read up my post about you.
MamiyaOtaru - Friday, February 25, 2011 - link
"prices will continue to fall"been waiting for them to become reasonable for years now, and this gets repeated when they go up?
I'm hoping for great things from memristors
Spazweasel - Monday, February 28, 2011 - link
So here's a question. With these solid state hard drives bursting to near the maximum transfer rate of SATA3 and completely eclipsing spinning media, the Holy Grail is going to be to approach RAMdisk speed.I'd be curious to see how a drive like this compares to, say, a 4gb RAM disk which has been formatted with the same file system. I imagine the RAMdisk driver and operating system will matter a great deal for such a baseline, but if a RAMdisk driver and config can be settled upon, this would make a very interesting comparison.
As far as I can tell, the SATA3 standard, with 6Gb/sec (little B) will saturate at about 525MB/sec (big B). DDR3/1333 will do so at 10667MB/sec. 20 times faster, right? Well... maybe. This is where file system and driver overhead will loom large. RAID will fatten up the pipe, and ultimately PCIE 2.0 16x will peak at 8192MB/sec (big B). Since PCIE 2.0/16x is close to DDR3/1333 in transfer speeds, in theory (that wonderful place where everything works), the aforementioned Holy Grail is at least in sight at the horizon.
So yeah, I'm curious about RAMdisks vs. fast SSDs in RAID. Just as an exercise.
iwod - Tuesday, March 1, 2011 - link
I know this is old, but can you brief us on WHAT THE HELL HAPPEN to Intel SSD Controller?Was it always suppose to be a Marvel Controller + Intel Firmware? Are is there REAL G3 coming soon?
WintersEdge - Wednesday, March 9, 2011 - link
So this is a preview, right? Although it's quite complete like a full review... Nevertheless, you'll do another review when the product actually comes out? Right? Or what? If so, will you add your energy use test, like you've done for SSD reviews in the past? I know it'll be very small but then again, all the differences in performance are also very small to an end user just doing ordinary tasks.Thanks