Far Cry 2 Dissected: Massive Amounts of Performance Data
by Derek Wilson on November 21, 2008 5:30 AM EST- Posted in
- GPUs
Benchmarking Software: an Analysis of Far Cry 2 Settings under AMD and NVIDIA
Before we get started, let's take a look at our test setup:
Platform: ASUS Rampage II Extreme, Core i7-965, 6GB DDR3-1333, Intel SSD
AMD Driver: Final 8.10 hotfix
NVIDIA Driver: 180.44
Our first goal in getting our testing rolling was to find out what to test and to understand the settings in the game better. We spent time playing the game at different quality levels with different hardware like we generally do. But because we wanted to take advantage of the benchmark tool, we decided to collect a bit of data on different settings with one card from AMD and one card from NVIDIA. We look at three different quality levels under two different DX APIs with two different AA settings across five different resolutions. For those keeping count, that's 60 tests per card or 120 tests total for this section.
The result isn't as much like our usual hardware focused tests, as this provides us with more of an analysis of the game itself. We get a better perspective on how the game responds in different situations with different hardware on different platforms without the need to test every piece of hardware out there. Our hope was that this page could help people who are running a particular setup see generally how performance might change if they tweaked one of the variables. Of course, you can't predict specific performance with this, as there isn't enough data for interpolation purposes, but knowing the general trend and what sort of changes make the largest differences can still be useful.
This test is run with our custom timedemo rather than any of the built in benchmarks.
The cards we chose are the highest end NVIDIA and AMD single GPU solutions (the GeForce GTX 280 and the Radeon HD 4870 1GB). While not everyone will have these cards, we were able to test the broadest range of playable data with them. We'll start our analysis with the NVIDIA hardware in DX9 and DX10.
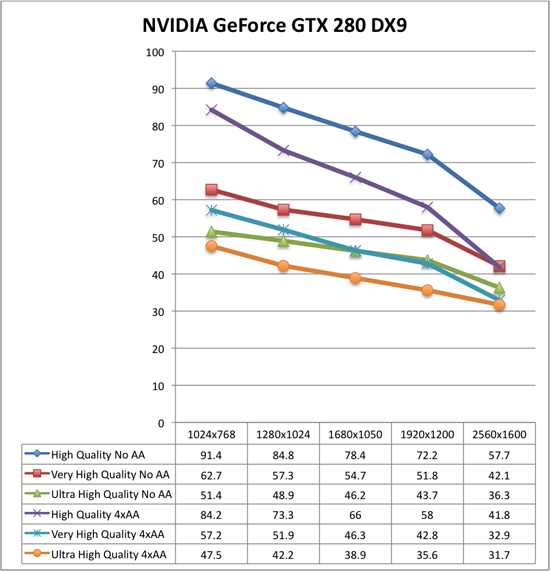
Now take a deep breath because these graphs can be a little tricky. Each graph is only 6 resolution scaling lines, but you'll want to approach them by looking at two groups of three: blue diamonds, red squares, green triangles are no antialiasing, while purple X, blue *, orange circles are 4xAA.
Under DX9 and NVIDIA hardware, High quality performs significantly higher than Very High quality both with and without AA. Moving from Very High quality to High quality gives at best a 47% increase in performance while the worst case is 27% with 4xAA and 37% without. Performance increases in this case generally trend downward as resolution increases. We also see that High quality 4xAA outperforms Very High quality with no AA. While there is a crossover point, Very High quality with 4xAA also performs very similarly to Ultra High quality with no AA.
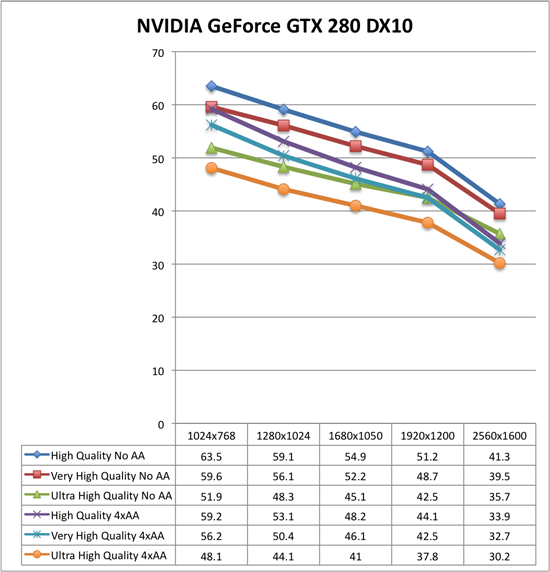
Moving to DX10 under NVIDIA hardware, High quality performance takes a dive while the rest of the numbers stay relatively stable. This basic indication here is that DX9 won't gain you much performance (and will sometimes drop your performance a bit) unless you are looking at High quality mode at which case it could be very worth it to run DX9. As a further consequence, the performance benefit of dropping down to High quality in DX10 mode makes it essentailly useless. High quality with 4xAA looses the advantage over Very High quality with no AA. Very High quality or better is the way to go under DX10, and DX9 should only be paired with High quality mode or lower.
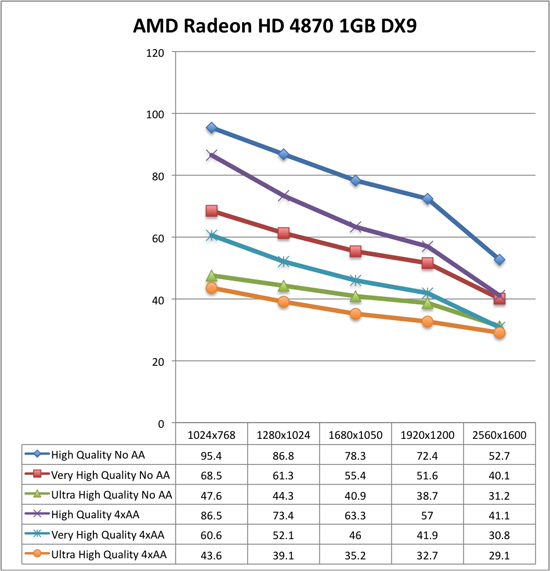
The analysis of the AMD data is very similar to what we see with NVIDIA. We see the same big performance advantage of High quality DX9 with DX10 actually increasing performance at the higher quality levels (the exception is at 2560x1600 where performance drops off more sharply than the GTX 280). The major difference here is in the fact that moving from Ultra High quality to Very High quality gives you a much larger performance increase under AMD than NVIDIA. This means that Very High 4xAA has a larger advantage over Ultra High with no AA (except at 2560x1600), and that it is more worth it to drop back to a lower quality setting to gain performance on AMD hardware. We still recommend Ultra High quality though, unless 4xAA is something you just can't live with out (in that case, Very High quality plus 4xAA is probably the way to go).
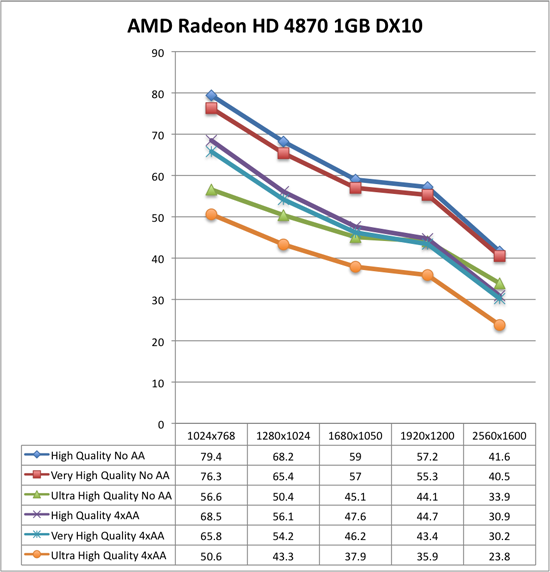
The comparison we haven't made yet is NVIDIA versus AMD. These tests show that under DX10 AMD Radeon HD 4870 1GB is either higher performing than or performing on par with the NVIDIA GeForce GTX 280 (except at ultra high resolutions with 4xAA). This is very impressive due to the $100 price advantage (the GeForce GTX 280 comes in at 33% more expensive than the Radeon HD 4870 1GB at $400). If you've got a 2560x1600 monitor and want to run Ultra High quality with 4xAA, that's the only case where the GeForce GTX 280 is worth it, though you'll be pushing the playability limit there and SLI with two cheaper cards might be a better way to go.
Going forward, we will be looking at DX10 with Ultra High quality settings and will generally favor testing without AA as we feel that Ultra High quality is a better use of resources than 4xAA. For multi-GPU and high end testing, we will still try to include 4xAA numbers though. This custom timedemo will also be the test we stick with rather than the built in RanchSmall demo.


78 Comments
View All Comments
toyota - Saturday, November 22, 2008 - link
graphics a joke? on very high or ultra they seem pretty good to me. now the character models look goofy but thats about it for my complaints on the way it looks. now gameplay is a different story. I am growing tired of driving around and running through re spawned enemy checkpoints as if nothing happened just 1 minute earlier. also the AI is stupid as hell. they will shoot at you and then look the other way or even up in the air sometimes. too bad ubi screwed this one up.Griswold - Saturday, November 22, 2008 - link
He's right though. Its aimed at consoles and thus the textures are "cheap" compared to whats possible. It has this typical console touch as far as visuals go. :(clairvoyant129 - Friday, November 21, 2008 - link
Every other sites show GTX 260 Core 216 leading over HD4870 1GB... tells you something about Anand.SiliconDoc - Friday, November 28, 2008 - link
Well someone has to cheer for the stuttering underdawg ... if they all told the truth, amd/ati sales would plummet and competition might then be over.I have been amazed myself - the kind of seemingly unavoidable bias that has been everywhere with the 4000 release - I guess they like the color red or hate the leader - LOL - no that wasn't a political comment.
Maybe it's cheering for the underdog - or blowing off pent up steam on the NV card namings and reissuings of barely changed cards with bit width and shaders mixed about in number.
Something is definitely causing it - but it is becoming ever clearer that just screaming ATI has a driver update every month won't cut it.
People cheer for what they like or bought, for whatever reason and with the massively complex benching and work involved it's no surprise one side gets a break the other side doesn't.
I certainly don't blame the people - gosh having to watch every word is difficult - and then meeting work deadlines - and colluding with the vendors that work with them - there's a lot more to the nightmare than I see when I'm critiquing the benchmark bias....
( Doesn't mean the bias isn't there - but then again human nature is complex )
Anyway, thanks for saying it - what you said about other benchmarks being different.
( Yes I saw Derek's explanation below - oh well pressure at the workplace makes things happen - and with everyone so touchy I suppose threats would issue if they didn't claim everything is almost equal. )
At least some can see clearly what is going on, that makes me happy.
kr7400 - Tuesday, December 2, 2008 - link
Can you please fucking die? Preferably by getting crushed to death in a garbage compactor, by getting your face cut to ribbons with a pocketknife, your head cracked open with a baseball bat, your stomach sliced open and your entrails spilled out, and your eyeballs ripped out of their sockets. *beep* bitch
I would love to kick you hard in the face, breaking it. Then I'd cut your stomach open with a chainsaw, exposing your intestines. Then I'd cut your windpipe in two with a boxcutter. Then I'd tie you to the back of a pickup truck, and drag you, until your useless *beep* corpse was torn to a million *beep* useless, bloody, and gory pieces.
Hopefully you'll get what's coming to you. *beep* bitch
I really hope that you get curb-stomped. It'd be hilarious to see you begging for help, and then someone stomps on the back of your head, leaving you to die in horrible, agonizing pain. *beep*
Shut the *beep* up f aggot, before you get your face bashed in and cut to ribbons, and your throat slit.
You're dead if I ever meet you in real life, f ucker. I'll f ucking kill you.
I would love to f ucking send your f ucking useless ass to the hospital in intensive care, fighting for your worthless life.
http://www.youtube.com/watch?v=Po0j4ONZRGY">http://www.youtube.com/watch?v=Po0j4ONZRGY
I wish you a truly painful, bloody, gory, and agonizing death, *beep*
Snarks - Saturday, November 22, 2008 - link
care to back that claim up, or just spew forth more bs?Carfax - Saturday, November 22, 2008 - link
Anandtech is the only website I've seen that shows ATI's part leading Nvidia in Far Cry 2.The GTX 260 216 is typically compared to the 4870 1GB in this game..
Anandtech is the only site I've seen where the 4870 1GB actually beats the GTX 280.
Also, there is NO MENTION whatsoever as to what Nvidia driver version the author uses in the article near as I can tell.
The 180xx series brings substantial performance increases for Nvidia cards in this game.
chizow - Saturday, November 22, 2008 - link
The Nvidia drivers and results are probably at least 3 weeks old:http://www.anandtech.com/weblog/showpost.aspx?i=51...">http://www.anandtech.com/weblog/showpost.aspx?i=51...
And the irony of it all, as the reason given as to why the review wasn't published earlier?:
If this FC2 review wasn't really "Shitting on AMD's Drivers Part 3" you might think AT was being biased. Personally I think its just poor testing standards. Derek is clearly being overambitious with his scope and the result is his work is dated before its even published. Derek really takes criticism and suggestions poorly though, so I doubt we'll see any changes. I was glad to see Gary Key include some additional info in his last set of benches, in a motherboard review of all places! http://www.anandtech.com/mb/showdoc.aspx?i=3459&am...">http://www.anandtech.com/mb/showdoc.aspx?i=3459&am...
DerekWilson - Monday, November 24, 2008 - link
My drivers for NVIDIA were 180.44This driver featured all the same performance improvements of 180.48, but I had access to it much earlier. The difference is that new features were not yet implemented. I did not use outdated performance data for this. Every other test with Far Cry 2 and NVIDIA would have either used this driver or the 180.43 (well, maybe they would have used 180.47 ... but either way, perf was the same).
The reason my results show the 4870 1GB pushing past the NV cards is very likely for two reasons: I made my own demo, and I took the highest of 3 runs per test rather than the average. It's easy to see that the custom demo does paint the 4870 1GB in a favorable light, and I explain why I take the highest of 3 runs on the second to last page when I'm talking about the problems we had with AMD drivers.
chizow - Monday, November 24, 2008 - link
I'm not sure how you can claim the drivers and performance is the same when:1) You are not using the 180.48 drivers.
2) Other review sites have shown significant differences in performance between drivers, even earlier 180.43 to 180.48.
http://www.hardwarecanucks.com/forum/hardware-canu...">http://www.hardwarecanucks.com/forum/ha...-2-hardw...
3) Your results are clearly the outlier amongst a sea of review sites that use the actual 180.48 drivers.
4) Your results are at least 3 weeks old, but you still consider them accurate because you think 180.44 = 180.48 in terms of performance.
Besides the other glaring problems with this review that you've acknowledged, that's a pretty far leap to make. Instead of just assuming the results between drivers are the same, why not re-run some tests to confirm or deny? As of right now, running these results really undermine you and the sites credibility.