The Radeon HD 4850 & 4870: AMD Wins at $199 and $299
by Anand Lal Shimpi & Derek Wilson on June 25, 2008 12:00 AM EST- Posted in
- GPUs
That Darn Compute:Texture Ratio
With its GT200 GPU, NVIDIA increased compute resources by nearly 90% but only increased texture processing by 25%, highlighting a continued trend in making GPUs even more powerful computationally. Here's another glance at the GT200's texture address and filter units:
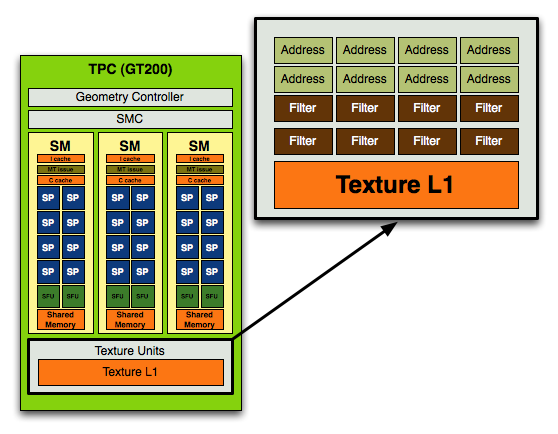
Each TPC, of which there are 10, has eight address and eight filter units. Now let's look at RV770:
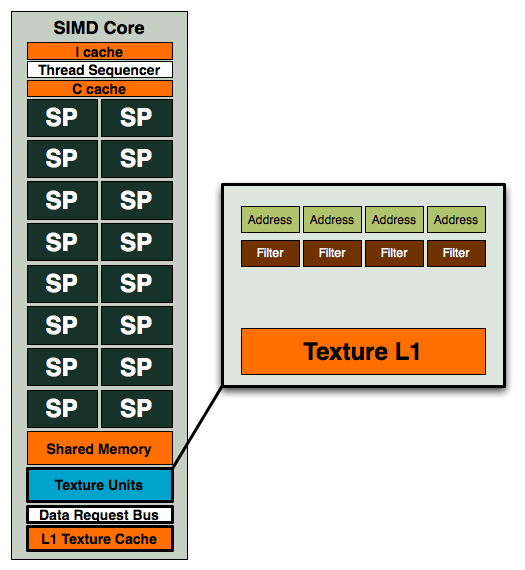
Four address and four filter units, while AMD maintains the same 1:1 address-to-filter ratio that NVIDIA does, the ratio of compute-to-texture in RV770 is significantly higher.
| AMD RV770 | AMD RV670 | NVIDIA GT200 | NVIDIA G92 | |
| # of SPs | 160 | 64 | 240 | 128 |
| Texture Address/Filter Units | 40 / 40 | 16 / 16 | 80 / 80 | 64 / 64 |
| Compute to Texture Ratio | 4:1 | 4:1 | 3:1 | 2:1 |
The table above illustrates NVIDIA's trend of increasing the compute to texture ratio from 2:1 in G92 to 3:1 in GT200. AMD arguably overshot with RV670 and its 4:1 ratio and thus didn't need to adjust it with RV770. Even while staying still at 4:1 with RV770, AMD's ratio is still more aggressively geared towards compute than NVIDIA's is. That does mean that more texture bound games will do better on NVIDIA hardware (at least proportionally), while more compute intensive games may do better on RV770.
AMD did also make some enhancements to their texture units as well. By doing some "stuff" that they won't tell us about, they improved the performance per mm^2 by 70%. Texture cache bandwidth has also been doubled to 480 GB/s while bandwidth between each L1 cache and L2 memory is 384 GB/s. L2 caches are aligned with memory channels of which there are four interleaved channels (resulting in 8 L2 caches).
Now that texture units are linked to both specific SIMD cores and individual L1 texture caches, we have an increase in total texturing ability due to the increase in SIMD cores with RV770. This gives us a 2.5x increase in the number of 8-bit per component textures we can fetch and bilinearly filter per clock, but only a 1.25x increase in the number of fp16 textures (as fp16 runs at half rate and fp32 runs at one quarter rate). It was our understanding that fp16 textures could run at full speed on R600, so the 1.25x increase in performance for half rate texturing of fp16 data makes sense.
Even though fp32 runs at quarter rate, with the types of texture fetches we would need to do, AMD says that we could end up being external memory bandwidth bound before we are texture filtering hardware bound. If this is the case, then the design decision to decrease rates for higher bit-depth textures makes sense.
| AMD RV770 | AMD RV670 | |
| L1 Texture Cache | 10 x 16KB (160KB total) | 32KB |
| L2 Texture Cache | I can has cache size? | 256KB |
| Vertex Cache | ? | 32KB |
| Local Data Share | 16KB | None |
| Global Data Share | 16KB | ? |
Even though AMD wouldn't tell us L1 cache sizes, we had enough info left over from the R600 time frame to combine with some hints and extract the data. We have determined that RV770 has 10 distinct 16k caches. This is as opposed to the single shared 32k L1 cache on R600 and gives us a total of 160k of L1 cache. We know R600's L2 cache was 256k, and AMD told us RV770 has a larger L2 cache, but they wouldn't give us any hints to help out.


215 Comments
View All Comments
NullSubroutine - Wednesday, June 25, 2008 - link
It scaled more than 100% in a few games?DerekWilson - Wednesday, June 25, 2008 - link
greater than 100% scaling is due to margin of error combination for both single card and dual card tests in the vast majority of cases.we also tested single card performance on an nvidia system and crossfire performance on an intel system, so the different computers will also add margin of error.
two card solutions generally don't scale at greater than 100% except in extraordinarily odd situations (where rebalancing loads might help with scaling on both individual cards -- but that's odd and rare).
Sind - Wednesday, June 25, 2008 - link
Why no 260 and 280 SLI?ImmortalZ - Wednesday, June 25, 2008 - link
Because, with that kind of money, one can an entire system with one 48xx :PAlso, page 10 appears to be broken.
Lifted - Wednesday, June 25, 2008 - link
No 260 or 280 SLI in the benchmarks, but they included them in the power charts. Odd.Anand Lal Shimpi - Wednesday, June 25, 2008 - link
The power data was simply taken from the GTX 280 review, we just added to the list.As for the GTX 280 SLI numbers, we didn't include them as it it's mostly out of the price range of the Radeon HD 4870 ($1300 vs. $600 for two 4870s). We can always go back and redo the graphs to include them if you guys would like, but in the interim I would suggest looking at the GTX review to get comparison numbers.
Take care,
Anand
DerekWilson - Wednesday, June 25, 2008 - link
we actually only have one GTX 260, so we can't test thatClauzii - Wednesday, June 25, 2008 - link
Yes, and the click to enlarge doesn't work.And believe it or not, posting right now from a AT page that looks like 1994...!
ImmortalZ - Wednesday, June 25, 2008 - link
Insert a buy in there. Need edit!TonyB - Wednesday, June 25, 2008 - link
but can it play crysis?