Beating the System: The AnandTech Guide to Economic Upgrading
by Kristopher Kubicki & Jarred Walton on January 30, 2005 5:59 PM EST- Posted in
- Guides
Putting it all together
So far, we showed how easy it was to build a model with retrospect data and how easy it was to build a model with made up continuous data. The goal now is to build a hybrid model from the previous two. Below is a list of hardware from the previous example, but using continuous devaluation overrides to "predict" the cost of each product after every four weeks.
| Quality Assumptions | Devaluation Override | |
| Radeon 9800 Pro | 200.00% | -1.00% |
| GeForce 6600GT | 240.00% | 1.67% |
| GeForceFX 5700 Ultra | 100.00% | 0.00% |
| GeForceFX 5900XT | 170.00% | -1.00% |
| Athlon 64 3000+ | 105.00% | 1.67% |
| Athlon 64 3200+ 512KB | 108.00% | 1.67% |
| Athlon 64 3200+ 1MB | 110.00% | 1.67% |
| Athlon 64 3400+ 512KB | 113.00% | 1.67% |
Again, continuous functions are bad for attempting to predict hardware pricing trends because pricing models for most components are structured on a discrete stair step algorithm using various price points. For those of you familiar with our pricing guides or the RTPE, you'll know that we watch a lot of prices at any one time. Purav, Adul and I can recite the exact distributor MRSP on every Intel processor at any given moment. We notice specific trends that can be readily identified with our historical data in the Real Time Engine (the graphs). Generally, after a new product has stabilized in price a little bit, a new processor, motherboard or video card will continue to devalue about 1.67% per month until the products retail EOL. Low demand products that hit EOL cling to their MSRP for a while (thus 0% devaluation) while high demand products will actually start to increase in price due to supply and demand (usually less than 1% per month). The Radeon 9800 Pro is actually a very good example of a video card that went through all three phases during its lifetime as a retail product. When all else fails, be a little too conservative with your estimates; the only thing that the devaluation should affect is whether or not it makes sense to upgrade today.
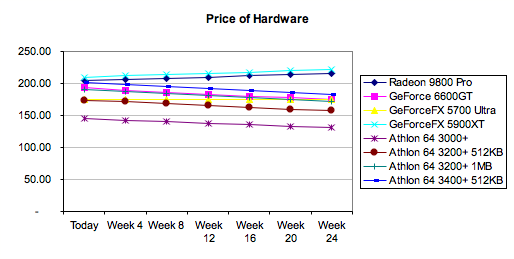
With some quick calculations, we can generate the estimated prices for the next six months based on today's hardware prices and the devaluation overrides that we just discussed above. The resulting graph looks as such:
Now, we can introduce our CNU value of $0.25 per day again and replot the graph.
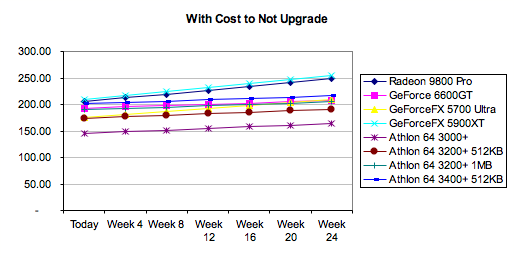
It should be pretty clear which hardware not to buy at this point; buying a GeForce 5900XT six months from now (if you can still find one) will cost you double, since you are paying for the retailers to mark up the price on their remaining stock even before taking into consideration the CNU. Adding the relative Quality for each product gives us the final plot below.

Click to enlarge.
Just based on mathematical formulas and some educated assumptions for relative Quality, the GeForce 6600GT comes out on top again with the Radeon 9800 Pro a mildly distant second. Upgrading the processor instead of the graphics card might actually make sense in this scenario (after the 6600GT) with the weights that we've given based on HL2 CPU and GPU scaling. All of the data from this page can be viewed in the second excel workbook from the spreadsheet available here.


50 Comments
View All Comments
Jedi2155 - Monday, January 31, 2005 - link
Anand should really have a VGA and a CPU chart of some sort as well! I don't really trust tomshardware all that much.But then, most of us don't anyways :P.
I like the article and its calculations tho...believe it or not....i use similar ones....
kmmatney - Monday, January 31, 2005 - link
sorry about the third post - but there is one statement that I think hits the nail on the head:"Determining the exact performance increase from a Radeon 9600 Pro to a Radeon X850XT is not something that you'll readily see published on AnandTech or anywhere else."
We can "almost" get this from Toms Hardware, from the VGA charts.
http://graphics.tomshardware.com/graphic/20041004/...
They don't have half-life 2, but there are enough benchmarks to at least allow for an informed decision. In fact, I used the article to help a friend buy a Radeon 9600 Pro, which was the best bang-for-buck at the time.
Why can't Anandtech have something similar, or the ability to create a similar graph on demand? Having the ability to chart both video card and cpu upgrades would be the ultimate tool for the upgrader.
kmmatney - Monday, January 31, 2005 - link
This article reminds me of something I always wanted. The ability to pull up benchmarks dynamically. I could put in my system specs, or select a similar procesor from a list. Untested speeds can be estimated to first order. Then I could pull up benchmarks from different video cards and compare exactly what I want.For now, I use the Toms Hardware video charts, as Anandtech doesn't have anything so comprehensive. A "Real-Time benchmark Engine" would be awesome for this.
kmmatney - Monday, January 31, 2005 - link
I'm a bit qith #19. It pains me to pay more than ~$100 for a video card. My plan was to stay with my Ti4200, but I managed to Ebay off $120 in old hardware last week, which brings my 6600GT upgrade down to an affordable $90, minus whatever nmy old card sells for. I'm definately sticking with my Athlon XP for a while, though.roostercrows - Monday, January 31, 2005 - link
excellent article kristopher, as i have had all the components for my new anandtech high end computer (except the video cards) just sitting on my bench for three months now just waiting... i can't help but think about what a price gouging graph would look like for the 6800gt pci-e sli video cards......Googer - Monday, January 31, 2005 - link
#13, I agree; but for some of us doing cost benefit analysis is part of the fun too. I really enjoy doing my mathmatics when I have the opertunity to do so. For me It is all part of the research that goes in to learning about new hardware. Its a hobby for me too.JarredWalton - Monday, January 31, 2005 - link
The point of this articles wasn't to give everyone a specific decision. Some people are always waiting for the ideal time to upgrade. If you're happy with your current computer, then by no means do you need to upgrade. If you're disappointed with performance, however, and you start thinking something like, "I'll wait for SLI..." or "X800XL is coming soon..." or soemthing similar, is it really worth the wait?That's the whole point behind the "cost to not upgrade". How much are you willing to spend per day for a better computing experience? We arbitratily chose 25 cents, but suppose you're willing to spend 50 cents or a dollar? Given the model in the spreadsheets, you can plug in various prices and estimated depreciatioin rates, and suddenly it may not look so important to wait for the X800XL or whatever.
The article certainly wasn't meant as a joke. It was intended as some reasoning behind our price guides. We don't often suggest people wait for the Next Big Thing, and the models presented here help to show why. We didn't even touch on the topic of market segmentation, which will often keep high-end parts at a higher price despite decreased production costs (witness SCSI, for example). There were plenty of other concepts that could also be applied. Hope that helps.
(I helped quite a bit with the article, so I feel I can safely put in my two cents.)
roostercrows - Monday, January 31, 2005 - link
Poser - Monday, January 31, 2005 - link
Thinking about it a bit more, I guess my situation (#19) could be wedged into the model you built pretty easily -- I don't have a Cost to Not Upgrade (CNU) of $0.25 a day, instead I have a NEGATIVE CNU. The longer I wait, the more cool gotta have 'em games will be released which I can't play on my old rig. That'll push up the value of current gen hardware.Chuckles - Sunday, January 30, 2005 - link
It looks like an interesting model. With some tweaking it looks like it may be valid for a variety of market segments. Cool.