Beating the System: The AnandTech Guide to Economic Upgrading
by Kristopher Kubicki & Jarred Walton on January 30, 2005 5:59 PM EST- Posted in
- Guides
A Simple Example
Now that we have the basics on what a graphical model looks like and how it functions, let us see if we can construct something similar for actual components. For this example, we are going to rewind into the past six months and base all of our devaluation assumptions on actual data pulled from our RealTime Price Engine. Suppose our hypothetical machine to upgrade looks like the following:Processor: Athlon 64 2800+ Socket 754This machine clearly looks GPU limited, but we won't let that stop us from choosing a whole subset of new components for our price set. Since we just did an article on it, the goal in this example will be to spend around $200 for a computer upgrade in order to maximize Half Life 2 performance. Once again, we need to add some padding on each end of the $200 budget so that we can have some leeway when we introduce Time into the model. Our list of products is as follows:
Memory: 512MB DDR-400
Video Card: ATI Radeon 9600 Pro
Motherboard: MSI nForce3 K8N Neo-FSR
Processor: All Socket 754 Processors better than an Athlon 64 2800+
Video Card: All AGP video cards better than a Radeon 9600 Pro
Let's plot as many of these components as possible on a graph denoting their price. We are slightly limited in our purchasing decision tree because we need to select components that fall within our designated price budget, but also components that are compatible with our hardware. This is a simple example, so we won't introduce components like memory, hard drives or motherboards for the time being. The prices were current prices as listed from the RealTime Price Engine. To keep our graphs neat, we separated video and graphics cards.
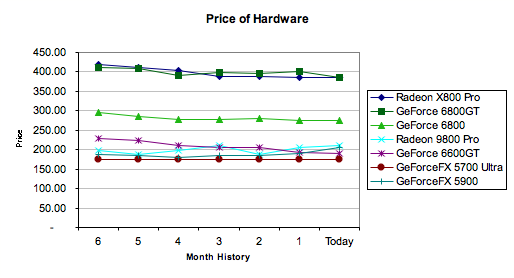
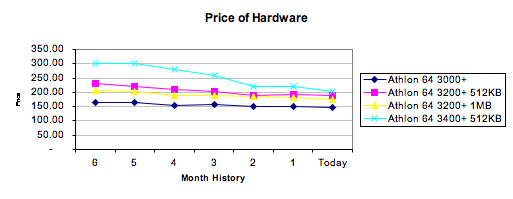
| Product | Price 6 Months Ago | Relative Quality | Product | Price 6 Months Ago | Relative Quality | |
| Radeon X800 Pro | $418.00 | 400.00% | Athlon 64 3000+ | $164.00 | 105.00% | |
| GeForce 6800GT | $412.00 | 400.00% | Athlon 64 3200+ 512KB | $230.00 | 108.00% | |
| GeForce 6800 | $295.00 | 260.00% | Athlon 64 3200+ 1MB | $205.00 | 110.00% | |
| Radeon 9800 Pro | $197.00 | 200.00% | Athlon 64 3400+ 512KB | $300.00 | 113.00% | |
| GeForce 6600GT | $228.00 | 240.00% | ||||
| GeForceFX 5700 Ultra | $175.00 | 100.00% | ||||
| GeForceFX 5900XT | $187.00 | 170.00% | ||||
This is a simple example geared toward a single application, so take these numbers with a grain of salt. You can see that we simply marked average FPS percentage increase as our quantitative values for Quality, but if we introduce more applications into our objective, we will have to use different values for Quality. We have placed some fairly conservative estimates on the relative quality between each component, but we cheated a little with the GeForce 6600GT and used the PCI Express pricing instead to demonstrate the model.
Below, you can see the actual price of each component as it changed throughout the last six months (The 6600GT is using PCIe pricing).
This looks real interesting, particularly with the subtle price swaps between each video card in the $200 segment. Now, we are just going to tilt the axis a little bit as we introduce our CNU variable of $0.25 again. After all, if our time is worthless, what is the point in upgrading this century?
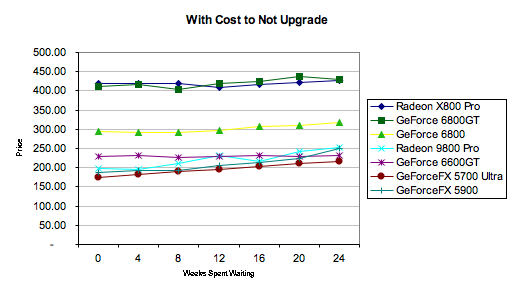
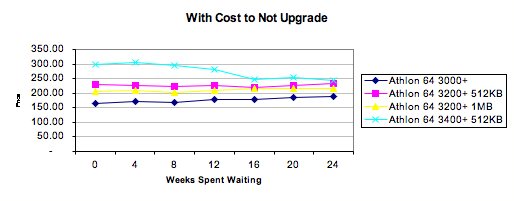
Things are looking really smooth now. In every instance, it is cheaper to buy today rather than buy tomorrow when we consider the $0.25 per day that it costs us to suffer through another agonizing frag fest at substandard performance. Finally, we just need to introduce quality into the equation and see which of these components maximizes our value, and when.

Click to enlarge.

Click to enlarge.
August 30, 2004 would have been a particularly fun day to determine an upgrade for a new system. In retrospect, the best card to purchase at that date would have been the GeForce 6600GT – but as we mentioned earlier, we flubbed the data a little bit for that video card, since only the PCIe version existed at that point. The second best performing card, for the dollar, was the Radeon 9800 Pro. We didn't even need to consider the higher end cards, since the laws of diminishing returns automatically compensated. Since the Radeon 9800 Pro is an older SKU and its price has been relatively static, it quickly falls off the board as the best value card, but it still has a higher Price to Quality ratio than anything else around $200 – including CPUs.
All of the data from this page can be viewed in the Excel workbook here.


50 Comments
View All Comments
trexpesto - Tuesday, March 8, 2005 - link
Or you could just ask on the forums like everyone does..#7 and others:
it is interesting to note that if you do have a fair degree of confidence in parts of an equation, the more factors you include, the more likely the errors will cancel out.
Unless you are consistently an optimist or pessimist!
I believe Enrico Fermi popularized this strategy, famously estimating the yield of an atomic blast by throwing torn-up strips of paper in the air. That part sounds suspiciously theatrical.
A classic one you hear about is a test question that asks the circumference of Earth. Well there are 3 one-hour time zones in the continental US, which is about 3000 miles across. Every thousand miles = 1 hour * 24 hours/day = 24000 miles.
Actually it's 24,901.55 miles at the equator but that's not toooo bad.
Gioron - Sunday, February 6, 2005 - link
I'm a bit late commenting, but oh well.Looking through this, its an interesting way to view upgrading, but I feel its a bit oversimplified and overcomplicated at the same time. Its oversimplified because you're just assuming a linear fit for most of the graphs, when things aren't really linear. Its overcomplicated because you're trying too hard to account for every single variable and making your explanations too complex for most people to really grasp. On the bright side, the basic concept you're trying to get across is something that a lot of people could really use and seem to overlook when making buying decisions.
As an example of how you're oversimplifying things, consider your "cost to not upgrade" that you're considering a flat $0.25. In reality, the cost to not upgrade is going to increase every day you wait. Its more of an exponential increase instead of a linear line, but there are large steps in the value as you start running into more things your current computer just can't do. As an example of this, my computer 3.5 years ago was fairly high end, it could play all the games, ran the current windows version well, and there wasn't a whole lot out there that was better. Sure, I could upgrade it, but the cost to me would only be about $0.01 a day, mainly from bragging rights. A year later, it was still a good computer, but new games had come out, a new version of windows had come out, and it was being asked to do new things. The games still ran at decent frame rates, but they could be better, windows didn't spend too much swapping out its now medium amount of RAM, but it was noticable now. At that point, upgrading the computer would be worth about $0.05 a day for me. The next year, new games came out where its performance dropped, new software came out that taxed it a bit, and I would definately see an improvement if I upgraded. At that point, it would be worth $0.25 for me to upgrade. A year later, you start hitting things is just plain _cannot_ handle. Can't run the latest games, processor can't handle real time video encodes that I wanted, etc. If I were still using it, it would be worth at least $2.50 a day for me to upgrade it. This is not a linear trend, but over the short term you can fool yourself into thinking that it is one. Assuming tomorrow is like yesterday, turning down the graphics in unreal tournament is worth the same amount of money, but once HL2 comes out the price suddenly jumps, and they'll constantly be coming out with more new software that is more and more taxing on the system. The same can also be said for some of the prices, since the "next best thing" you keep telling people not to wait for tends to push prices down suddenly, but in between prices fall at a slower rate. The period of time you're looking at for video cards and processors is really farily stable, but that doesn't mean its like that all the time.
I'll spare you the explanation for why I feel you're overcomplicating the issue, but suffice it to say that it shouldn't take that many pages and charts to explain when to buy. You might need the charts if you were trying for a definitive "buy X in Y weeks" article, but you're aiming for a general "this is what to consider when buying" article, and that can be done in a lot simpler words and with less graphs.
So... what would I recommend instead? A more relaxed approach, but one that considers some of the same things as the article. I guess the heart of what I would say is "don't forget that having something now compared to later has value", it seems to be the one thing many people overlook. Aside form that, I can't really think of a mathematical model that would give an accurate depiction of the many variables, so I guess I'll leave it at that.
JarredWalton - Wednesday, February 2, 2005 - link
For what it's worth, I don't know that a full-blown model of all potential upgrades would really be feasible or terribly useful, PrinceGaz. There are *SO* many factors to consider, and while ceratin tests will show a difference in performance, otheres might not change much at all.We really only looked at two of the major components in a computer, as they are often the bottleneck. RAM capacity is really the only other major factor. If we were to try to add in HDD, motherboards, PSUs, etc. then the model quickly becomes something that not even a mathlete would properly understand without staring for a while.
As for the Quality to Price topic, for upgrading it becomes very difficult to model properly while including your present Quality to Price. If you assume your current system as 100% performance with 0 cost, you get a divide by zero error. In fact, any price for your current hardware other than its original price is going to skew a graph heavily in favor of not upgrading. Which leads to my take on the situation.
The impetus for an upgrade has to be that you're unsatisfied with the current level of performance. If you're more or less happy, don't bother upgrading! Once you decide to upgrade, however, Forget about selling old hardware, forget about all the other stuff, and just pretend you're going to ditch what you have and buy something new. If you try to take all of the other variables into account, you again end up with a confusing model.
If you want to be "fair" in the model, you can always take the price for all hardware and add the MSRP for your current hardware to it. So if you have a $100 9600 Pro, rather than saying it's "free" (and getting divide by zero), say it costs $100 but the 9800 Pro costs $300. Three times the price for maybe double the performance. The 25 cents per day CNU then changes as well, I think. If you want to play a game like Doom 3 and it runs poorly on your 9600 Pro, CNU is going to be more than 25 cents each day.
My final comment (for now) is that the hypothetical system we were going to upgrade was chosen for a reason: we could forget motherboard, RAM, and many other components for an upgrade. A more realistic upgrade would have an older mobo, PSU, RAM, etc. and would need more than $200 to get a lot better performance. If you actually have an A64 2800+ with a 9600 Pro, you're probably going to be quite happy with it. :)
MadAd - Wednesday, February 2, 2005 - link
#11 Hahahaha, right on - statistics sux huh :-)LordConrad - Wednesday, February 2, 2005 - link
I think this article should have been called "The Mathletes Guide to Upgrading". As this article proves, it is certainly possible to overcomplicate things. For those of you (like me) who hate calculating and charting stuff, check out posts 31-32 for a much simpler way to accomplish the same tasks.PrinceGaz - Tuesday, February 1, 2005 - link
Thanks for the explanation. Perhaps the article should be retitled "The Economic Guide to Building a New System", instead of the misleading "Economic Guide to Upgrading" as it most certainly isn't about upgrading.The only part of the article which even considers what you might upgrade from is where you set the quality of that at 100% and every option is relative to that. The graphs would be identical (except for the scale) if you just suggested people put the raw framerate from benchmarks in, as setting an arbitrary level to 100% (what you are upgrading from) doesn't affect the results at all.
I was under the impression this was a guide to economic upgrading, and it could so easily have been if you'd deducted the quality and (optionally) the second-hand value of whatever you upgrade from. Upgrading is about replacing something old with something better, and the quality and price of an upgrade is therefore the quality of what you buy minus what you have, and the price is the cost of the upgrade minus what you can sell what you have for.
"I actually modeled the "Quality - 100%" approach, and while the Quality to Price graphs changed in terms of numbers, the overall slopes were about the same.". Did you try that with the example I gave, or anything approaching a wide-range of upgrade options? The slopes might be similar but where they are on the graph are totally different. Your current sheet could very easily recommend someone to upgrade to something slower, and this is an article about upgrading! In fact I'm sure it would recommend a low-end Sempron as the best upgrade choice for someone with a fast Barton or Athlon 64. You really need to make it clear that the quality and value of what you have must be deducted from any upgrade option.
I'm sorry to go on about this, but whilst it was a very interesting (if heavy going) article, it was so flawed from being "The AnandTech Guide to Economic Upgrading" that it really needs correcting. Either change what the article addresses (new system builds instead of upgrades), or correct it to reflect upgrading.
JarredWalton - Tuesday, February 1, 2005 - link
38 - PrinceGaz, the current model does actually reflect more of a "what part should I purchase" mentality as opposed to an upgrade. So if you consider that the model is based off of that, the charts are still valid. The simple approach would be to take the spreadsheet and plug in your own quality, price, and depreciation values along with your own CNU to see how things look.There are a myriad number of ways to model the situation, and only the individual can readily determine how important an upgrade is to them. The idea behind the article is still sound, even if some of the graphs don't necessarily look right. I actually modeled the "Quality - 100%" approach, and while the Quality to Price graphs changed in terms of numbers, the overall slopes were about the same.
CrapONez - Monday, January 31, 2005 - link
Good article that makes you think about cost/benefit rationalization to upgrades - for those who need it or simply are curious.The problem I had with this article was in determining the cost of not upgrading. So the game/encode/compile runs slowly on your computer. Where's the bottleneck? Processor? Amount of memory? Memory speed/bandwidth?
Anandtech has plenty of reviews where various components are upgraded to determine the effect of each upgrade on total performance. We don't have that luxury. Determining which component to upgrade is often more difficult than selecting which model to upgrade to.
PrinceGaz - Monday, January 31, 2005 - link
http://images.anandtech.com/reviews/buyersguide/20...they put a space in front of cost_continuous.xls in the link on page 3
malikarshad - Monday, January 31, 2005 - link
The link for excel worksheet is not working. Can somebody post a valid link