Beating the System: The AnandTech Guide to Economic Upgrading
by Kristopher Kubicki & Jarred Walton on January 30, 2005 5:59 PM EST- Posted in
- Guides
Putting it all together
So far, we showed how easy it was to build a model with retrospect data and how easy it was to build a model with made up continuous data. The goal now is to build a hybrid model from the previous two. Below is a list of hardware from the previous example, but using continuous devaluation overrides to "predict" the cost of each product after every four weeks.
| Quality Assumptions | Devaluation Override | |
| Radeon 9800 Pro | 200.00% | -1.00% |
| GeForce 6600GT | 240.00% | 1.67% |
| GeForceFX 5700 Ultra | 100.00% | 0.00% |
| GeForceFX 5900XT | 170.00% | -1.00% |
| Athlon 64 3000+ | 105.00% | 1.67% |
| Athlon 64 3200+ 512KB | 108.00% | 1.67% |
| Athlon 64 3200+ 1MB | 110.00% | 1.67% |
| Athlon 64 3400+ 512KB | 113.00% | 1.67% |
Again, continuous functions are bad for attempting to predict hardware pricing trends because pricing models for most components are structured on a discrete stair step algorithm using various price points. For those of you familiar with our pricing guides or the RTPE, you'll know that we watch a lot of prices at any one time. Purav, Adul and I can recite the exact distributor MRSP on every Intel processor at any given moment. We notice specific trends that can be readily identified with our historical data in the Real Time Engine (the graphs). Generally, after a new product has stabilized in price a little bit, a new processor, motherboard or video card will continue to devalue about 1.67% per month until the products retail EOL. Low demand products that hit EOL cling to their MSRP for a while (thus 0% devaluation) while high demand products will actually start to increase in price due to supply and demand (usually less than 1% per month). The Radeon 9800 Pro is actually a very good example of a video card that went through all three phases during its lifetime as a retail product. When all else fails, be a little too conservative with your estimates; the only thing that the devaluation should affect is whether or not it makes sense to upgrade today.
With some quick calculations, we can generate the estimated prices for the next six months based on today's hardware prices and the devaluation overrides that we just discussed above. The resulting graph looks as such:
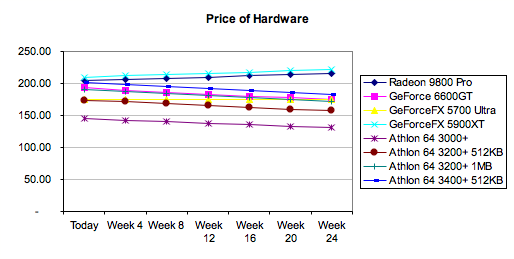
Now, we can introduce our CNU value of $0.25 per day again and replot the graph.
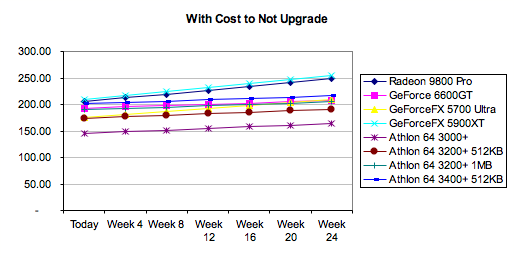
It should be pretty clear which hardware not to buy at this point; buying a GeForce 5900XT six months from now (if you can still find one) will cost you double, since you are paying for the retailers to mark up the price on their remaining stock even before taking into consideration the CNU. Adding the relative Quality for each product gives us the final plot below.

Click to enlarge.
Just based on mathematical formulas and some educated assumptions for relative Quality, the GeForce 6600GT comes out on top again with the Radeon 9800 Pro a mildly distant second. Upgrading the processor instead of the graphics card might actually make sense in this scenario (after the 6600GT) with the weights that we've given based on HL2 CPU and GPU scaling. All of the data from this page can be viewed in the second excel workbook from the spreadsheet available here.


50 Comments
View All Comments
PrinceGaz - Monday, January 31, 2005 - link
Just to take the above example one step further, if the quality of card A in the above example was only 90% instead of 110%, so it is slower than what you already have; the graph in your sheet still shows it as the best choice.Spend $100 and get something slower :)
stephenbrooks - Monday, January 31, 2005 - link
"What do we do to indecisive people who ask us when to upgrade?""Confuse them with graphs!!"
Sorry. It was a good idea. But as previous posters have said, what would be über-cool is to have the realtime pricing and entire benchmark database linked up to your formulae, and then let the user tweak the weighting factors on which things they find most important, and see what the site says. I guess it's a heck of a lot of work, though... maybe in 2010... :)
PrinceGaz - Monday, January 31, 2005 - link
I'm afraid your calculations are fundamentally flawed from the point of view of upgrading.You assume that a product which is equal to what you already have (so it's not an upgrade at all) has a quality of 100%, and something twice as fast is 200%. That's fine if you are not upgrading but buying something totally new instead, but when upgrading you have to deduct the quality of what you already have from each of the potential upgrades, so subtract 100% from the quality as you already have that before upgrading. That would mean something that is the same as what you already have has a quality of 0% when considered as an upgrade, an upgrade twice as fast has a quality of 100%, three times as fast has a quality of 200%, and so on. Something half as fast would have a quality of -50% as it is not an upgrade.
If selling your existing hardware when performing the upgrade, you should also deduct the amount you expect to sell it for from the cost of each potential upgrade option. The amount you can sell it for is likely to go down over time so that needs to be taken into account as well.
To take a theoretical (but plausible) example and use the sheet you presented-
Card A- $100, 110%
Card B- $200, 170%
Card C- $300, 240%
Card D- $400, 260%
the graph clearly shows card A is the best option, followed by B, then C, then D. But who in their right mind would spend $100 to upgrade to a card that is only 10% faster than what they already have?!
Deduct 100% from the quality of each of those cards and the graph makes a lot more sense, with card C coming out on top, then D, then B, then A far behind the rest. Which is what you would expect as an upgrade to something 10% faster is a waste of money.
Until the sheets and article are corrected, it is a very poor guide to upgrading.
KristopherKubicki - Monday, January 31, 2005 - link
It should be Quality to Price - that will be fixed very soon.Thanks,
Kristopher
CannonFodderjm - Monday, January 31, 2005 - link
"Price to Quality" is best when high?!This confused me until the end, when I just gave up trying to understand your analyses and realized you made a "naming" mistake. It should be reversed.
Great analysis, but this was too distracting.
Please fix for the sake of others' sanity!
gimper48 - Monday, January 31, 2005 - link
This was a great article but really leads to analysis paralysis. I am happy you guys do this for us. We really really appreciate it especially those of us who forget to carry the zero.MarkM - Monday, January 31, 2005 - link
#32, "I don't see those charts and formulas changing this all that much. You can tell which group you're in by checking your needs and your bank account," with all due respect, that was exactly the issue that the article so thouroughly addressed - for people who fit into ANY of your 3 categories, to identify the place in which to most effectively apply resources to address the perceived problem. You are the exact kind of person who could use a methodology like this, the person who's computer is slower than they want and/or need to do some specific task(s), but whose current approach to addressing a quantifiable need is nothing more rigourous than "Look at the Price Guide for the hardware you want [ed: I thought we were addressing a NEED, not a WANT?] to upgrade. Look at the components from lowest performing and go up from there. When you see the big price jump stop" Where in any of this methodology do we find ANY attempt to answer the question "will this upgrade resolve my slowdown"???guest - Monday, January 31, 2005 - link
Maybe now should be a good time to post an article about when to stop buying hardware :)In some cases it's better I think not to upgrade at all.
Like when you don't buy anymore games or just do the occasional OS upgrade or just browse the internet.
LordConrad - Monday, January 31, 2005 - link
People who upgrade (or buy a whole new computer) fall into one of three categories, either by choice or due to financial concerns:1. People who upgrade immediately when their computer starts to get a little slow.
2. People who wait until the slowdown gets annoying.
3. People who wait until their computer laughs at them when they try to run a program.
I don't see those charts and formulas changing this all that much. You can tell which group you're in by checking your needs and your bank account. Why over-complicate things.
LordConrad - Monday, January 31, 2005 - link
What the heck was all that crap? Upgrading is much easier than that and has two steps:1. Keeping your performance needs in mind, find the bottlenecks that are keeping you from reaching that performance.
2. Replace the component(s) that are causing the biggest bottlenecks, while staying within your price range.
Choosing Price/Performance:
Look at the Price Guide for the hardware you want to upgrade. Look at the components from lowest performing and go up from there. When you see the big price jump stop. The item just before the big price jump is usually the best as far as Price/Performance.