Beating the System: The AnandTech Guide to Economic Upgrading
by Kristopher Kubicki & Jarred Walton on January 30, 2005 5:59 PM EST- Posted in
- Guides
Building the Model
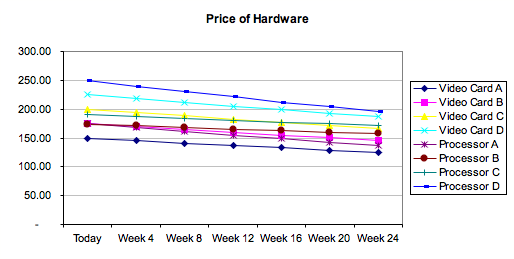
Before we get too carried away with variables and equations, it's time that we put something down on paper (or computer screen, in this instance). Without taking into account Time - when to buy - a simple plot of a set of products along the interval $150 to $250 dollars looks like this:
| Product | Price |
| Video Card A | $150 |
| Video Card B | $175 |
| Video Card C | $200 |
| Video Card D | $225 |
| Processor A | $175 |
| Processor B | $200 |
| Processor C | $225 |
| Processor D | $250 |
This chart is pretty useless. The reason why we introduced products deviating by $50 from our set allowance of $200 is to account for fluctuations in price once we introduce Time into the model. If all hardware devalues at the same dollar amount, exposing time to the equation is pointless. Generally processors take a dip in price every few weeks, so let's see what would happen if we put a 3% price cut on the products every four weeks on video cards, and a 4% price cut on processors. This discrete model doesn't make a lot of sense, since hardware generally devalues at a discrete rate, but in the meantime, we will use it for this example.
Here comes the important step - how much is your time worth? An easy way to visualize this is if you had a computer at work, and six minutes of your day every day was wasted waiting for Outlook to load up. Your company is paying you two hours a month on lost productivity. You can put any value per hour on this number, but let's say the Cost of not upgrading your existing hardware comes down to $0.25 per day; each day you don't upgrade it costs you another 25 cents on the resale value of your old hardware, or in lost productivity, or something else along those lines. The actual Cost to Not Upgrade (per day) can actually be something more abstract as well. Perhaps in the few hours per day that I play World of Warcraft, the frustration that I get while waiting for the screen to render is worth $0.25 per day. For the purposes of this example, we will just say that we value a new computer upgrade at $0.25 per day. This skews our graphs slightly.
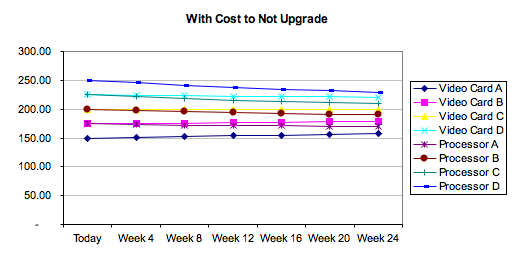
Things have changed a little bit on this graph. Notice that it actually gets more expensive to wait six months before buying Video Card C, even though the vendor sells it for slightly less. Putting this quantitative value on how much our time is worth per day gets us out of the perpetual waiting cycle that we had mentioned earlier. It becomes real easy to say "I can just wait six months for the cost to drop $200," but if that's your mentality, then why upgrade at all? The upgrade isn't needed if there is no cost associated with waiting.
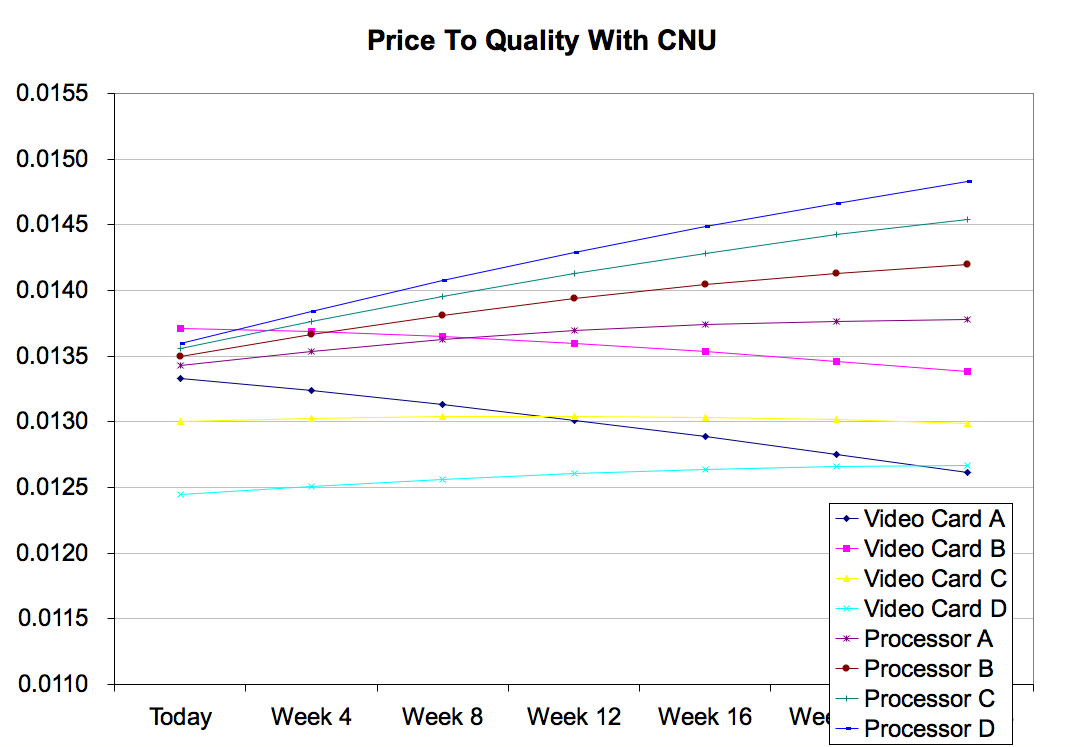
And finally, just to make things really interesting, let's take the Quality of each component and base it on a fictional benchmark like a video game. Each component's relative quality is listed as a percentage of base performance. Just by taking the price variable P and dividing by Q, we've changed our graph enough to give a pretty realistic representation of what a generic model looks like.
| Product | Price | Quality |
| Video Card A | $150 | 200.00% |
| Video Card B | $175 | 240.00% |
| Video Card C | $200 | 260.00% |
| Video Card D | $225 | 280.00% |
| Processor A | $175 | 235.00% |
| Processor B | $200 | 270.00% |
| Processor C | $225 | 305.00% |
| Processor D | $250 | 340.00% |
Click to enlarge.
What we are seeing in this graph is that we will get best return on our investment at different times for different parts, assuming the constant rate of decline in price and a 25 cents per day cost to not upgrade. For example, we get the the most out of a dollar by buying Processor D in six months - in fact, looking at the curve in the graph, it would be better to continue to wait even longer! If our time is only worth $0.25 per day, it apparently isn't worth it to buy any of the new processors today - only the "budget" processor A is a good buy. Otherwise, we would be overpaying for the Quality. Of course, Processor D is a little bit out of our price budget too. We maximize our price to quality by week 12 for Processor B, and Processor C looks to be leveling off towards week 24. All of the video cards, on the other hand, will actually maximize our performance for our dollar if we buy right now.
To demonstrate the entire process that we just described above, we created a simple Excel workbook. By modifying the assumptions highlighted in yellow, we can create a dynamic graphical process to easily verify two things: whether or not it makes sense to upgrade now, and the relative Price and Quality of each product in our set. The idea is to purchase the hardware that gives us the largest Price to Quality ratio while taking in account the Cost to Not Upgrade (we refer to this as CNU). If the maximum ratio exists at some other date than the start date of the model, then either our CNU per Day doesn't reflect our need to upgrade accurately, or the part in question is too expensive for its relative quality.


50 Comments
View All Comments
PrinceGaz - Monday, January 31, 2005 - link
Just to take the above example one step further, if the quality of card A in the above example was only 90% instead of 110%, so it is slower than what you already have; the graph in your sheet still shows it as the best choice.Spend $100 and get something slower :)
stephenbrooks - Monday, January 31, 2005 - link
"What do we do to indecisive people who ask us when to upgrade?""Confuse them with graphs!!"
Sorry. It was a good idea. But as previous posters have said, what would be über-cool is to have the realtime pricing and entire benchmark database linked up to your formulae, and then let the user tweak the weighting factors on which things they find most important, and see what the site says. I guess it's a heck of a lot of work, though... maybe in 2010... :)
PrinceGaz - Monday, January 31, 2005 - link
I'm afraid your calculations are fundamentally flawed from the point of view of upgrading.You assume that a product which is equal to what you already have (so it's not an upgrade at all) has a quality of 100%, and something twice as fast is 200%. That's fine if you are not upgrading but buying something totally new instead, but when upgrading you have to deduct the quality of what you already have from each of the potential upgrades, so subtract 100% from the quality as you already have that before upgrading. That would mean something that is the same as what you already have has a quality of 0% when considered as an upgrade, an upgrade twice as fast has a quality of 100%, three times as fast has a quality of 200%, and so on. Something half as fast would have a quality of -50% as it is not an upgrade.
If selling your existing hardware when performing the upgrade, you should also deduct the amount you expect to sell it for from the cost of each potential upgrade option. The amount you can sell it for is likely to go down over time so that needs to be taken into account as well.
To take a theoretical (but plausible) example and use the sheet you presented-
Card A- $100, 110%
Card B- $200, 170%
Card C- $300, 240%
Card D- $400, 260%
the graph clearly shows card A is the best option, followed by B, then C, then D. But who in their right mind would spend $100 to upgrade to a card that is only 10% faster than what they already have?!
Deduct 100% from the quality of each of those cards and the graph makes a lot more sense, with card C coming out on top, then D, then B, then A far behind the rest. Which is what you would expect as an upgrade to something 10% faster is a waste of money.
Until the sheets and article are corrected, it is a very poor guide to upgrading.
KristopherKubicki - Monday, January 31, 2005 - link
It should be Quality to Price - that will be fixed very soon.Thanks,
Kristopher
CannonFodderjm - Monday, January 31, 2005 - link
"Price to Quality" is best when high?!This confused me until the end, when I just gave up trying to understand your analyses and realized you made a "naming" mistake. It should be reversed.
Great analysis, but this was too distracting.
Please fix for the sake of others' sanity!
gimper48 - Monday, January 31, 2005 - link
This was a great article but really leads to analysis paralysis. I am happy you guys do this for us. We really really appreciate it especially those of us who forget to carry the zero.MarkM - Monday, January 31, 2005 - link
#32, "I don't see those charts and formulas changing this all that much. You can tell which group you're in by checking your needs and your bank account," with all due respect, that was exactly the issue that the article so thouroughly addressed - for people who fit into ANY of your 3 categories, to identify the place in which to most effectively apply resources to address the perceived problem. You are the exact kind of person who could use a methodology like this, the person who's computer is slower than they want and/or need to do some specific task(s), but whose current approach to addressing a quantifiable need is nothing more rigourous than "Look at the Price Guide for the hardware you want [ed: I thought we were addressing a NEED, not a WANT?] to upgrade. Look at the components from lowest performing and go up from there. When you see the big price jump stop" Where in any of this methodology do we find ANY attempt to answer the question "will this upgrade resolve my slowdown"???guest - Monday, January 31, 2005 - link
Maybe now should be a good time to post an article about when to stop buying hardware :)In some cases it's better I think not to upgrade at all.
Like when you don't buy anymore games or just do the occasional OS upgrade or just browse the internet.
LordConrad - Monday, January 31, 2005 - link
People who upgrade (or buy a whole new computer) fall into one of three categories, either by choice or due to financial concerns:1. People who upgrade immediately when their computer starts to get a little slow.
2. People who wait until the slowdown gets annoying.
3. People who wait until their computer laughs at them when they try to run a program.
I don't see those charts and formulas changing this all that much. You can tell which group you're in by checking your needs and your bank account. Why over-complicate things.
LordConrad - Monday, January 31, 2005 - link
What the heck was all that crap? Upgrading is much easier than that and has two steps:1. Keeping your performance needs in mind, find the bottlenecks that are keeping you from reaching that performance.
2. Replace the component(s) that are causing the biggest bottlenecks, while staying within your price range.
Choosing Price/Performance:
Look at the Price Guide for the hardware you want to upgrade. Look at the components from lowest performing and go up from there. When you see the big price jump stop. The item just before the big price jump is usually the best as far as Price/Performance.