The Intel Comet Lake Core i9-10900K, i7-10700K, i5-10600K CPU Review: Skylake We Go Again
by Dr. Ian Cutress on May 20, 2020 9:00 AM EST- Posted in
- CPUs
- Intel
- Skylake
- 14nm
- Z490
- 10th Gen Core
- Comet Lake
Power
We kind of gave a sneak preview on the front page with our frequency graph, but the short answer as to whether these new Core i9 processors really need 250 W for 10 cores is yes. Intel sent us details on what it has determined should be the recommended settings for its K processor line:
- Core i9-10900K: TDP is 125 W, PL2 is 250 W, Tau is 56 seconds
- Core i7-10700K: TDP is 125 W, PL2 is 229 W, Tau is 56 seconds
- Core i5-10600K: TDP is 125 W, PL2 is 182 W, Tau is 56 seconds
For those not used to these terms, we have the TDP or Thermal Design Power, which is meant to be the long-term sustained power draw of the processor at which Intel guarantees the base frequency of the processor – so in this case, the Core i9-10900K guarantees that with a heavy, long-running workload it will max out at 125 W with a frequency of at least 3.7 GHz (the base frequency).
The PL2 is known as the turbo power limit, which means that while the processor is allowed to turbo, this is the upper power limit that the processor can reach. As mentioned on the first page of this review, the value for PL2 is only a suggested guide, and Intel lets motherboard vendors set this value to whatever they want based on how well the motherboard is designed. Sometimes in laptops we will see this value lower than what Intel recommends for thermal or battery reasons, however on consumer motherboards often this value is as high as it can possibly be.
The final term, Tau, is meant to be a time by which the turbo can happen. In reality the TDP value and the Tau value is multiplied together to give a value for a ‘bucket’ of energy that the processor can use to turbo with. The bucket is refilled at a continuous rate, but if there is excess energy then the processor can turbo – if the bucket is being emptied at the same rate as it is refilled, then the processor is down at the long-term TDP power limit. Again, this is a value that Intel recommends and does not fix for the vendors, and most consumer motherboards have Tau set to 999 seconds (or the equivalent of infinite time) so the processor can turbo as much as possible.
Note, when we asked Intel about why it doesn’t make these hard specifications and how we should test CPUs given that we’re somewhat enable to keep any motherboard consistent (it might change between BIOS revisions) for a pure CPU review, the response was to test a good board and a bad board. I think that on some level Intel’s engineers don’t realize how much Intel’s partners abuse the ability to set PL2 and Tau to whatever values they want.
All that aside, we did some extensive power testing on all three of our CPUs across a number of simulation and real-world benchmarks.
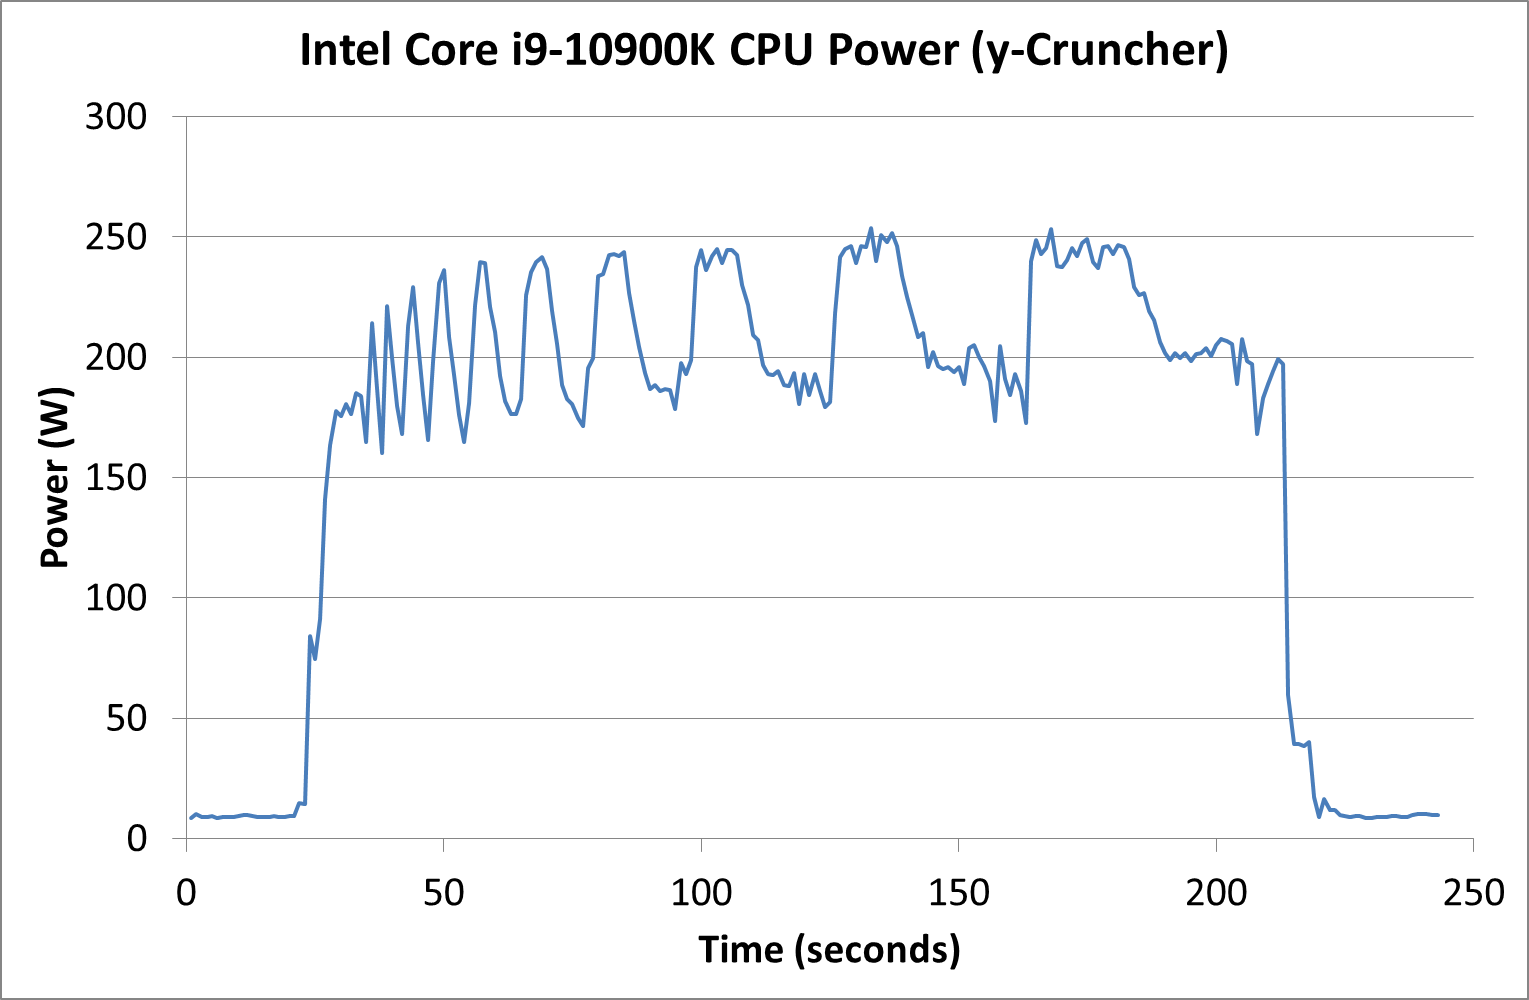
Core i9-10900K Power
Through our tests, we saw the Intel Core i9-10900K peak at 254 W during our AVX2-accelerated y-cruncher test. LINPACK and 3DPMavx did not push the processor as hard.
The more real-world tests, AI Benchmark and Photoscan, showed that in a variable operation workload mixing threads, we are more likely to see the 125-150 W range, with spikes up to 200W for specific operations.

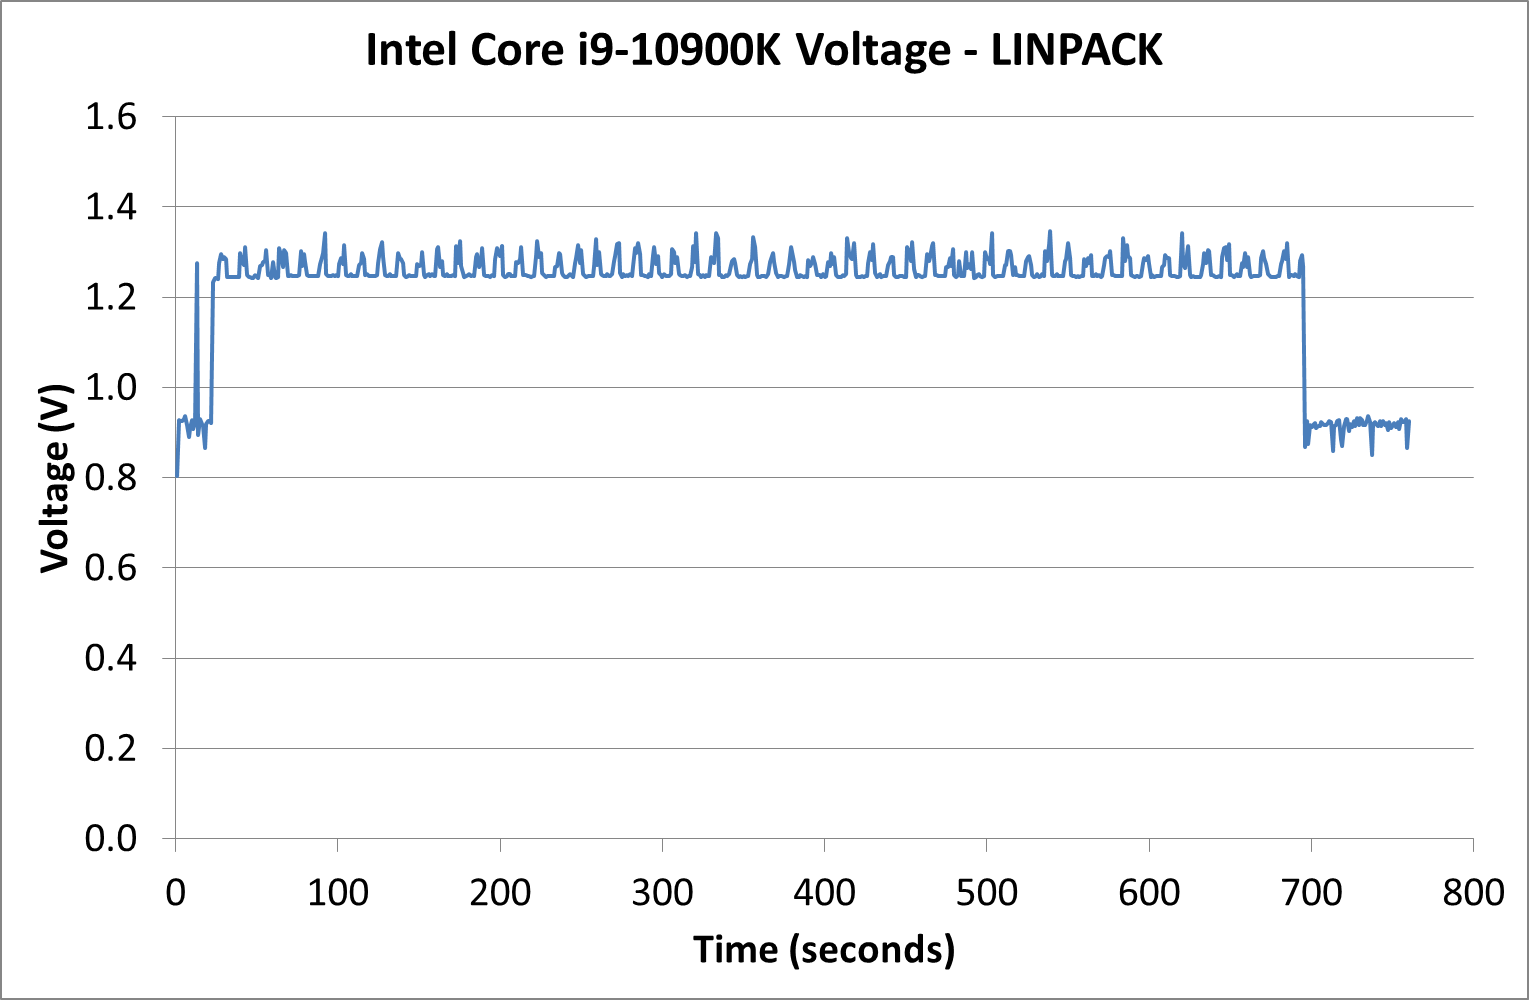
For users interested in the voltage for our Core i9-10900K, we saw the processor peak at 1.34 volts, however even during an AVX2 workload it was nearer to 1.25 volts.
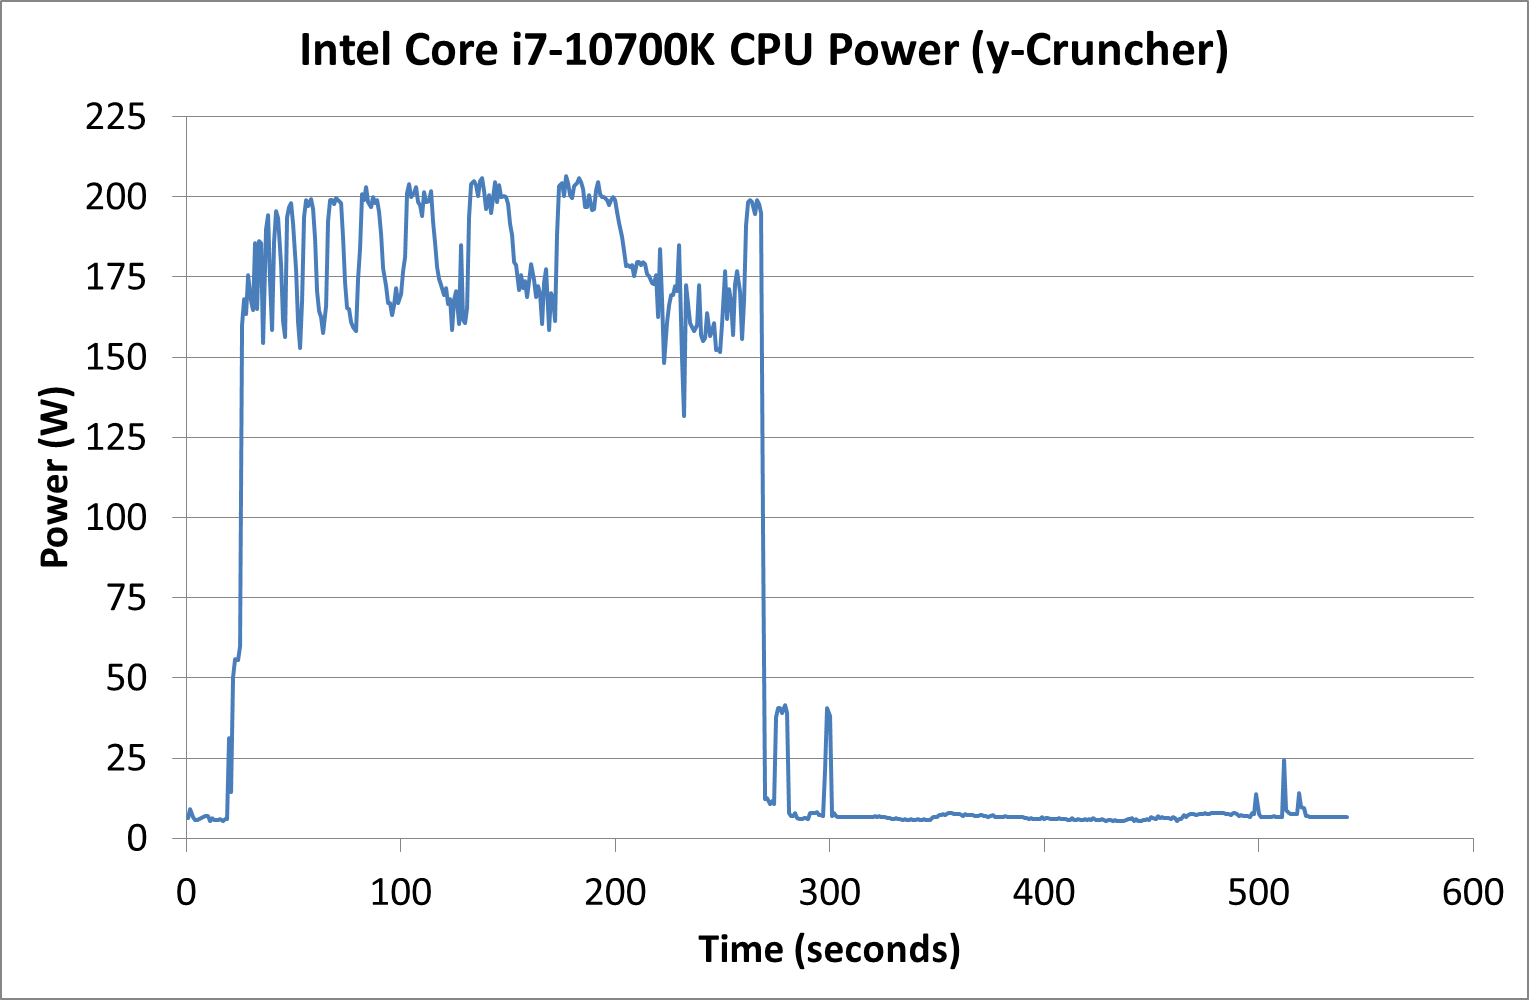
Intel Core i7-10700K
The Intel Core i7-10700K is rated by Intel to have a peak turbo power of 229 W, however our sample peaked at 207 W during y-Cruncher. LINPACK achieved similar results, whereas 3DPMavx was nearer 160 W.
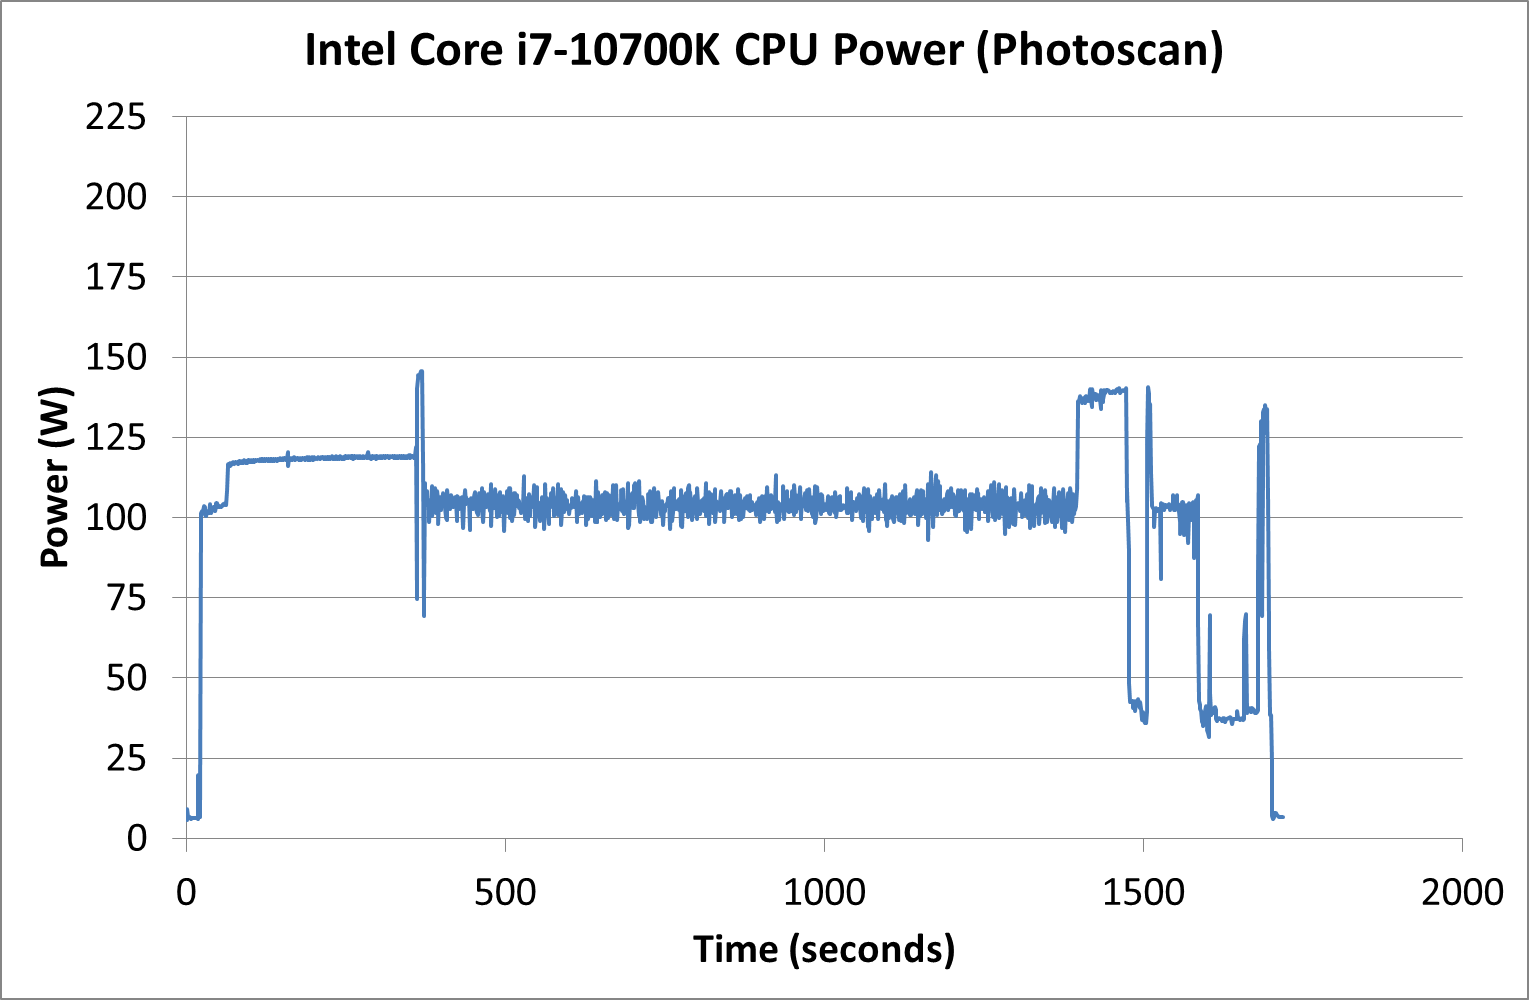
Our AI Benchmark power wrapper failed for the 10700K due to a configuration issue, but the Photoscan ‘real world’ power test put the processor mostly in the 100-125 W range, peaking just below 150 W in a couple of places.
Intel Core i5-10600K
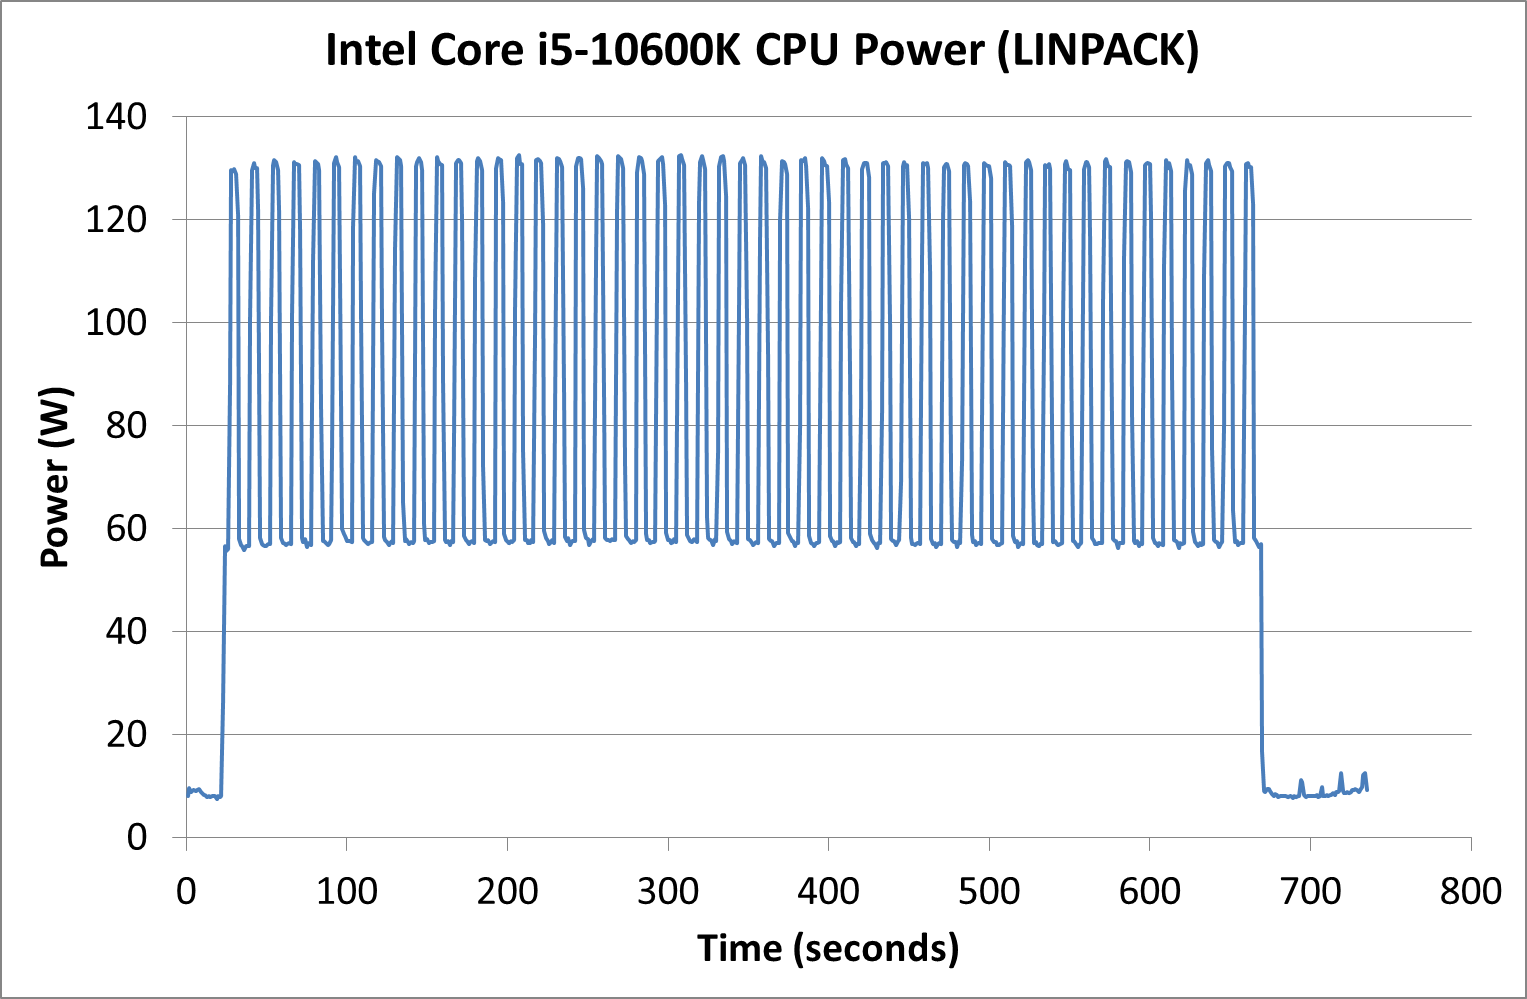
Intel’s Core i5-10600K has a recommended PL2 of 182 W, but we observed a peak of 125 W in y-Cruncher and 131 W in LINPACK.
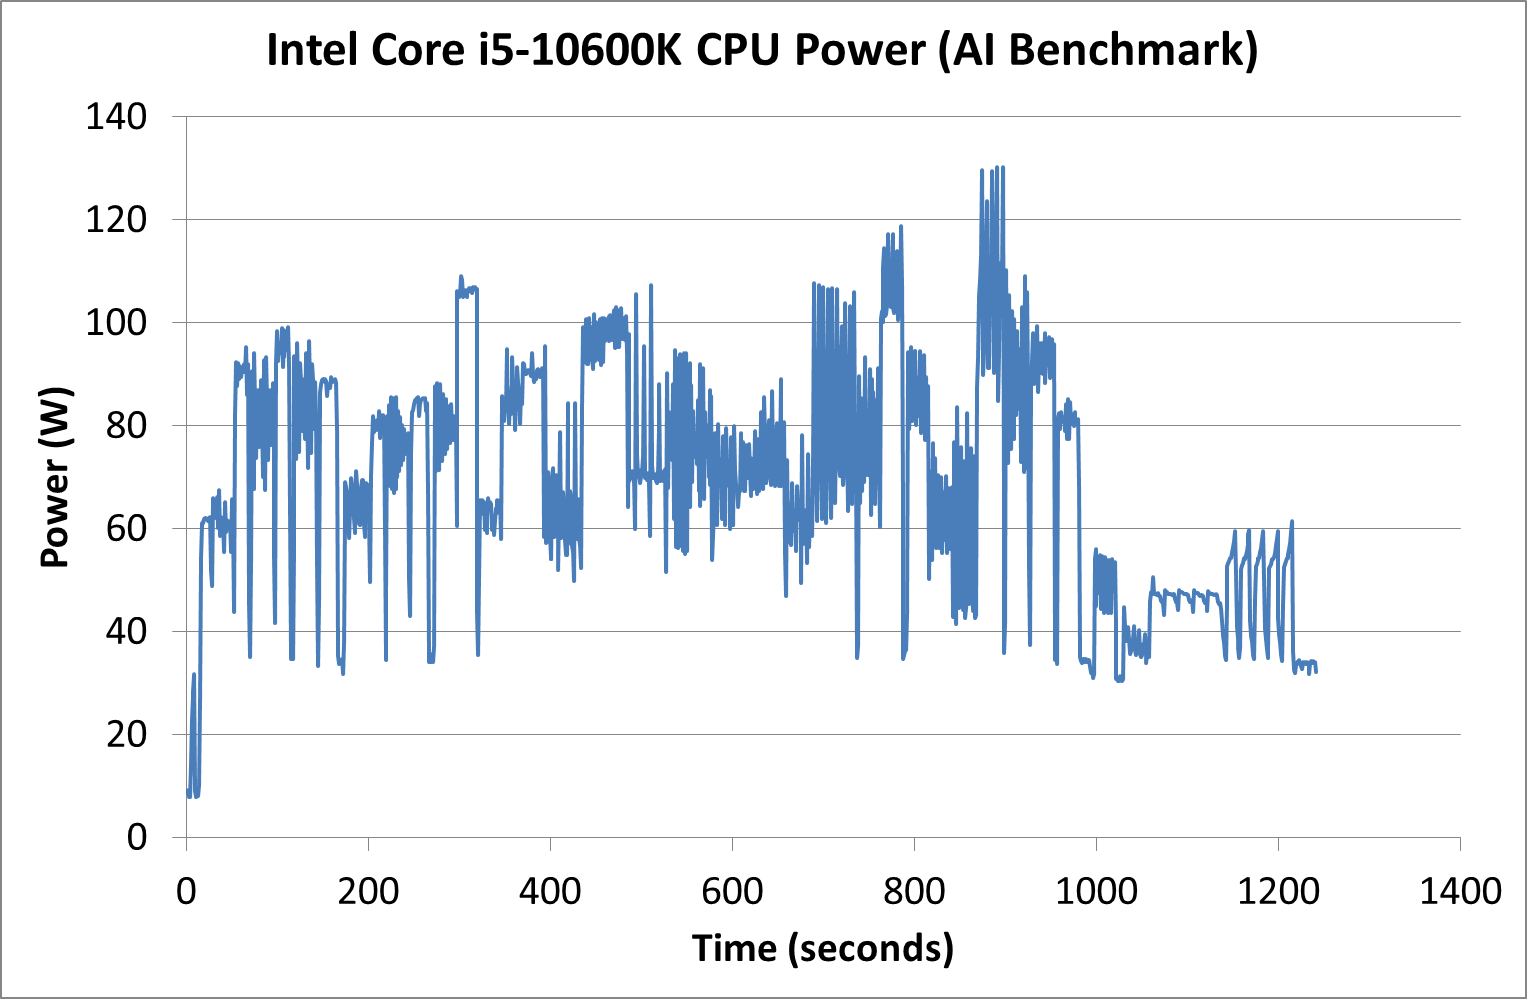
We actually saw our AI Benchmark real-world test hit 130 W as well, while Photoscan was nearer the 60-80 W range for most of the test.
The full set of power graphs can be found here:


In terms of overall peak power consumption, our values look like this:
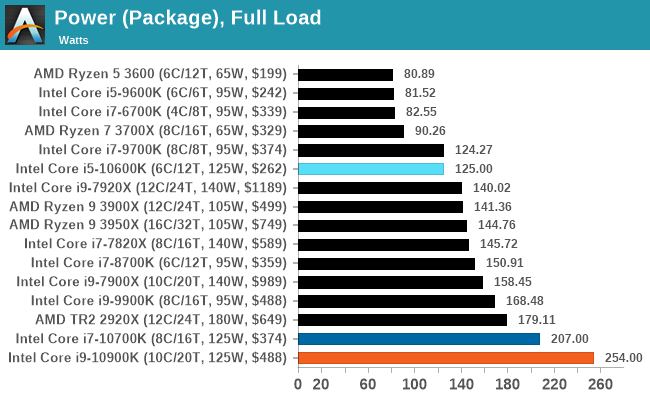
Note, 254 W is quite a lot, and we get 10 cores at 4.9 GHz out of it. By comparison, AMD's 3990X gives 64 cores at 3.2 GHz for 280 W, which goes to show the trade-offs between going wide and going deep. Which one would you rather have?


220 Comments
View All Comments
ByteMag - Wednesday, May 20, 2020 - link
I'm wondering why the 3300X wasn't in the DigiCortex benchmark? This $120 dollar 4c/8t banger lays waste to the selected lineup. Or is it too much of a foreshadowing of how Zen 3 may perform? I guess benchmarks can sometimes be like a box of chocolates.ozzuneoj86 - Wednesday, May 20, 2020 - link
Just a request, but can you guys consider renaming the "IGP" quality level something different? The site has been doing it for a while and it kind of seems like they may not even know why at this point. Just change it to "Lowest" or something. Listing "IGP" as a test, when running a 2080 Ti on a CPU that doesn't have integrated graphics is extremely confusing to readers, to say the least.Also, I know the main reason for not changing testing methods is so that comparisons can be done (and charts can be made) without having to test all of the other hardware configs, but I have one small request for the next suite of tests (I'm sure they'll be revised soon). I'd request that testing levels for CPU benchmarks should be:
Low Settings at 720P
Max Settings at 1080P
Max Settings at 1440P
Max Settings at 4K
(Maybe a High Settings at 1080P thrown in for games where the CPU load is greatly affected by graphics settings)
Drop 8K testing unless we're dealing with flagship GPU releases. It just seems like 8K has very little bearing on what people are realistically going to need to know. A benchmark that shows a range from 6fps for the slowest to 9fps for the fastest is completely pointless, especially for CPU testing. In the future, replacing that with a more common or more requested resolution would surely be more useful to your readers.
Often times the visual settings in games do have a significant impact on CPU load, so tying the graphical settings to the resolution for each benchmark really muddies the waters. Why not just assume worst case scenario performance (max settings) for each resolution and go from there? Obviously anti-aliasing would need to be selected based on the game and resolution, with the focus being on higher frame rates (maybe no or low AA) for faster paced games and higher fidelity for slower paced games.
Just my 2 cents. I greatly appreciate the work you guys do and it's nice to see a tech site that is still doing written reviews rather than forcing people to spend half an hour watching a video. Yeah, I'm old school.
Spunjji - Tuesday, May 26, 2020 - link
Agreed 99% with this (especially that last part, all hial the written review) - but I'd personally say it makes more sense for the CPU reviews to be limited to 720p Low, 1080P High and 1440P Max.My theory behind that:
720p Low gives you that entirely academic CPU-limited comparison that some people still seem to love. I don't get it, but w/e.
1080p High is the kind of setting people with high-refresh-rate monitors are likely to run - having things look good, but not burning frames for near-invisible changes. CPU limiting is likely to be in play at higher frame rates. We can see whether a given CPU will get you all the way to your refresh-rate limit..
1440p Max *should* take you to GPU-limited territory. Any setting above this ought to be equally limited, so that should cover you for everything, and if a given CPU and/or game doesn't behave that way then it's a point of interest.
dickeywang - Wednesday, May 20, 2020 - link
With more and more cores being added to the CPU, it would've been nice to see some benchmarks under Linux.MDD1963 - Wednesday, May 20, 2020 - link
Darn near a full 2% gain in FPS in some games! Quite ...uhhh..... impressive! :/MDD1963 - Wednesday, May 20, 2020 - link
Doing these CPU gaming comparisons at 720P is just as silly as when HardOCP used to include 640x480 CPU scaling...; 1080P is low enough, go medium details if needed.Spunjji - Tuesday, May 26, 2020 - link
Personally agreed here. It just gives more fodder to the "15% advantage in gaming" trolls.croc - Wednesday, May 20, 2020 - link
It would be 'nice' if the author could use results from the exact same stack of chips for each test. If the same results cannot be obtained from the same stack, then whittle the stack down to those chips for which the full set of tests can be obtained. I could understand the lack of results on newly added tests...For a peer review exercise it would be imperative, and here at Anandtech I am sure that there are many peers....
69369369 - Thursday, May 21, 2020 - link
Overheating and very high power bills happens with Intel.Atom2 - Thursday, May 21, 2020 - link
Dear Ian, You must be the only person on the planet that goes to such lengths not to use AVX, that you even compare Intel's AVX512 instructions to a GPU based OpenCL, just to have a reason not to use it. Consequently you only have AMD win the synthetic benchmarks, but all real world math is held by Intel. Additionally, all those synthetics, which are "not" compiled with Intel C++. Forget it... GCC is only used by Universities. The level of bias towards AMD is becoming surreal.