Workstation Graphics: AGP Cross Section 2004
by Derek Wilson on December 23, 2004 4:14 PM EST- Posted in
- GPUs
SPECViewperf 8.0.1 Performance
For our SPECviewperf tests, we will look at graphs of the overall weighted scores for each viewset. We have also listed the scores for the individual tests for each viewset. For each section, we will begin by listing the description of the viewset from the SPEC website, and then analysing the data.For futher details on how SPECviewperf scores are compiled, please see the SPEC website.
All cards were set to their default professional graphics settings, whatever those happened to be, before running SPECviewperf.
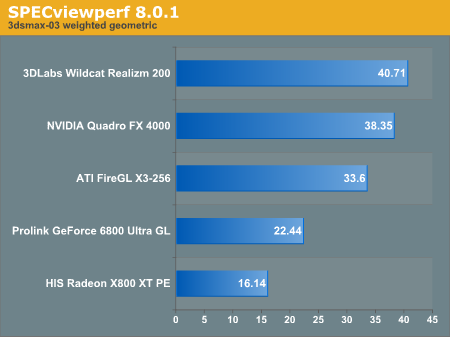
3dsmax Viewset (3dsmax-03)
"The 3dsmax-03 viewset was created from traces of the graphics workload generated by 3ds max 3.1. To ensure a common comparison point, the OpenGL plug-in driver from Discreet was used during tracing.The Wildcat Realizm 200 leads in this benchmark, followed by the Quadro FX 4000. This is quite interesting, since by street price, the Realizm is the cheapest card that we have in the bunch. ATI's MSRP is lower than the 3Dlabs part, but value is all in purchasing power and performance.
The models for this viewset came from the SPECapc 3ds max 3.1 benchmark. Each model was measured with two different lighting models to reflect a range of potential 3ds max users. The high-complexity model uses five to seven positional lights as defined by the SPECapc benchmark and reflects how a high-end user would work with 3ds max. The medium-complexity lighting models use two positional lights, a more common lighting environment.
The viewset is based on a trace of the running application and includes all the state changes found during normal 3ds max operation. Immediate-mode OpenGL calls are used to transfer data to the graphics subsystem."
The DCC side of the workstation market isn't as large as CAD/CAM, but 3DStudio is still an important application. Of course, this viewset tests straight OpenGL performance, and each of these workstation cards have a custom driver for 3DStudio Max, which we will test in the SEPCapc portion of our benchmark suite.
| SPECviewperf 8.0.1 3dsmax-03 | ||||||||||||||
| 1 | 2 | 3 | 4 | 5 | 6 | 7 | 8 | 9 | 10 | 11 | 12 | 13 | 14 | |
| Quadro FX 4000 | 38.6 | 38.5 | 21.8 | 18.8 | 75 | 53.7 | 40.6 | 30.6 | 17.2 | 70.3 | 25.3 | 26.2 | 21 | 20.1 |
| Wildcat Realizm 200 | 38.6 | 38 | 30.2 | 24.3 | 74.1 | 62.1 | 43.5 | 40.4 | 28.3 | 68.7 | 24.1 | 24.1 | 18.3 | 18.3 |
| FireGL X3-256 | 32.2 | 27.3 | 23.4 | 18.5 | 62.8 | 51 | 28.9 | 31.9 | 18.6 | 66.6 | 20.5 | 20.6 | 16 | 16.1 |
| GeForce 6800 U GC | 17.5 | 15.9 | 14.8 | 14.7 | 42.4 | 29.2 | 27.1 | 19.1 | 14.9 | 40.8 | 14.2 | 14.1 | 11.5 | 11.2 |
| Radeon X800 XTPE | 12 | 8.09 | 12.5 | 10.7 | 35.9 | 23.6 | 11.6 | 15.8 | 10 | 32.7 | 11.4 | 6.37 | 9.3 | 7.86 |
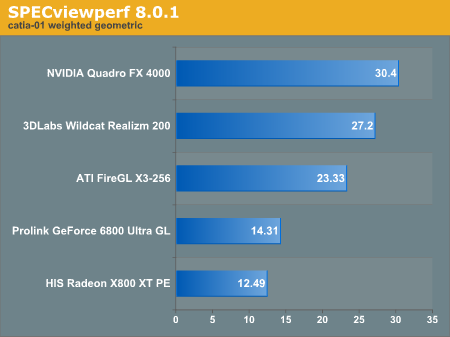
CATIA Viewset (catia-01)
"The catia-01 viewset was created from traces of the graphics workload generated by the CATIATM V5R12 application from Dassault Systemes.The state change information found in the CATIA is a big part of the improvement in SPECviewperf 8. The nature of OpenGL as a state machine is the major advantage of the API in workstation applications. The viewing and manipulation of state are key elements in workstation graphics today. Taking a look at performance here, we see the Quadro FX 4000 taking the lead on this one followed by the Realizm 200.
Three models are measured using various modes in CATIA. Phil Harris of LionHeart Solutions, developer of CATBench2003, supplied SPEC/GPC with the models used to measure the CATIA application. The models are courtesy of CATBench2003 and CATIA Community.
The car model contains more than two million points. SPECviewperf replicates the geometry represented by the smaller engine block and submarine models to increase complexity and decrease frame rates. After replication, these models contain 1.2 million vertices (engine block) and 1.8 million vertices (submarine).
State changes as made by the application are included throughout the rendering of the model, including matrix, material, light and line-stipple changes. All state changes are derived from a trace of the running application. The state changes put considerably more stress on graphics subsystems than the simple geometry dumps found in older SPECviewperf viewsets.
Mirroring the application, draw arrays are used for some tests and immediate mode used for others."
| SPECviewperf 8.0.1 catia-01 | |||||||||||
| 1 | 2 | 3 | 4 | 5 | 6 | 7 | 8 | 9 | 10 | 11 | |
| Quadro FX 4000 | 48.9 | 37.2 | 26.9 | 27.9 | 19 | 47.8 | 29.6 | 28.9 | 19 | 23.2 | 46.1 |
| Wildcat Realizm 200 | 52.1 | 38.6 | 15.8 | 29.7 | 18.9 | 63.3 | 32.5 | 27.6 | 22 | 20.6 | 13.7 |
| FireGL X3-256 | 39.7 | 25.8 | 19.1 | 22.8 | 16.2 | 34 | 25.2 | 18.8 | 15 | 19.1 | 34.8 |
| GeForce 6800 U GC | 20.2 | 22.5 | 11.5 | 12.6 | 8.9 | 31.1 | 17.2 | 4.49 | 11.2 | 12.7 | 27.2 |
| Radeon X800 XTPE | 20.9 | 10.3 | 10.9 | 11.7 | 7.38 | 26.7 | 13.1 | 12.5 | 8.86 | 7.41 | 21 |
EnSight (ensight-01)
"The ensight-01 viewset replaces the Data Explorer (dx) viewset. It represents engineering and scientific visualization workloads created from traces of CEI's EnSight application.This time around, we see the FireGL X3-256 jump to the head of the pack. Even though the X3-256 has trailed in the previous tests, it has managed to clearly lead the EnSight performance tests.
CEI contributed the models and suggested workloads. Various modes of the EnSight application are tested using both display-list and immediate-mode paths through the OpenGL API. The model data is replicated by SPECviewperf 8.0 to generate 3.2 million vertices per frame.
State changes as made by the application are included throughout the rendering of the model, including matrix, material, light and line-stipple changes. All state changes are derived from a trace of the running application. The state changes put considerably more stress on graphics subsystems than the simple geometry dumps found in older viewsets.
Mirroring the application, both immediate-mode and display-list modes are measured."
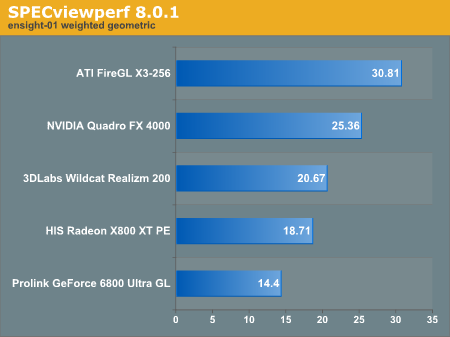
Six out of the nine tests are led by the FireGL X3. Interestingly, in tests 5, 6, and 8, the Realizm 200 leads both the FireGL X3-256 and the Quadro FX 4000. Test 1 has a weight of 12, while the following 8 tests have a weight of 11 each.
| SPECviewperf 8.0.1 ensight-01 | |||||||||
| 1 | 2 | 3 | 4 | 5 | 6 | 7 | 8 | 9 | |
| Quadro FX 4000 | 42.7 | 35.4 | 35.6 | 31.1 | 13.7 | 13.6 | 31 | 13.8 | 31 |
| Wildcat Realizm 200 | 24.5 | 20.9 | 26.7 | 23 | 16 | 15.9 | 23 | 16 | 23 |
| FireGL X3-256 | 53.6 | 50 | 53.7 | 44.6 | 12.3 | 12.3 | 44.7 | 12.3 | 44.6 |
| GeForce 6800 U GC | 11.6 | 3.98 | 39.3 | 34.1 | 7.22 | 7.23 | 34 | 7.26 | 34 |
| Radeon X800 XTPE | 14.1 | 54.4 | 45.5 | 34.8 | 5.84 | 5.78 | 34.8 | 5.8 | 34.8 |
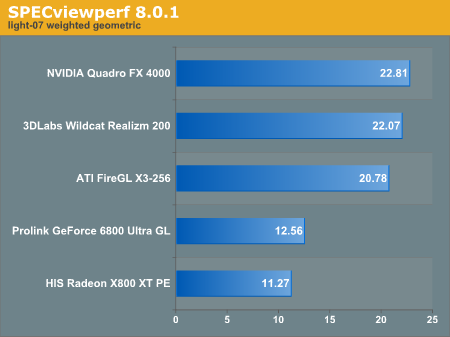
Lightscape Viewset (light-07)
"The light-07 viewset was created from traces of the graphics workload generated by the Lightscape Visualization System from Discreet Logic. Lightscape combines proprietary radiosity algorithms with a physically-based lighting interface.The Quadro FX 4000 outpeforms the Wildcat Realizm by about 3.4% in the lighscape test. This time, the FireGL X3-256 is back where we would expect based on ATI's positioning of the product.
The most significant feature of Lightscape is its ability to accurately simulate global illumination effects by pre-calculating the diffuse energy distribution in an environment and storing the lighting distribution as part of the 3D model. The resulting lighting "mesh" can then be rapidly displayed."
| SPECviewperf 8.0.1 light-07 | |||||
| 1 | 2 | 3 | 4 | 5 | |
| Quadro FX 4000 | 23.7 | 37.5 | 18.1 | 13.8 | 27.8 |
| Wildcat Realizm 200 | 25.4 | 44.3 | 14.1 | 12.8 | 25.8 |
| FireGL X3-256 | 24.8 | 44.5 | 12.5 | 11.6 | 24.2 |
| GeForce 6800 U GC | 13.2 | 24.2 | 9.06 | 6.75 | 16 |
| Radeon X800 XTPE | 12.1 | 22.6 | 7.96 | 5.89 | 14.2 |
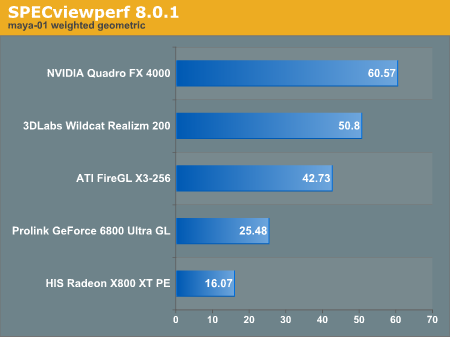
Maya Viewset (maya-01)
"The maya-01 viewset was created from traces of the graphics workload generated by the Maya V5 application from Alias.The clear leader in this test is the Quadro FX 4000. The NVIDIA part leads every test under Maya by a large margin. The differences between each card are very large all the way down to the X800 XT PE.
The models used in the tests were contributed by artists at NVIDIA. Various modes in the Maya application are measured.
State changes as made by the application are included throughout the rendering of the model, including matrix, material, light and line-stipple changes. All state changes are derived from a trace of the running application. The state changes put considerably more stress on graphics subsystems than the simple geometry dumps found in older viewsets.
As in the Maya V5 application, array element is used to transfer data through the OpenGL API."
| SPECviewperf 8.0.1 maya-01 | |||||||||
| 1 | 2 | 3 | 4 | 5 | 6 | 7 | 8 | 9 | |
| Quadro FX 4000 | 152 | 52.5 | 37.2 | 42.6 | 27.6 | 100 | 82.3 | 82.7 | 49.6 |
| Wildcat Realizm 200 | 126 | 41.1 | 30.8 | 33.3 | 17.7 | 96.3 | 79.8 | 76.8 | 44.7 |
| FireGL X3-256 | 110 | 33.3 | 23.2 | 29.2 | 20.6 | 82 | 51.1 | 63.7 | 37.2 |
| GeForce 6800 U GC | 54 | 24.5 | 16 | 12.8 | 10 | 52 | 39.5 | 37.4 | 23.7 |
| Radeon X800 XTPE | 25.2 | 14.9 | 9.02 | 8.03 | 7.2 | 36.1 | 26.7 | 25 | 16.3 |
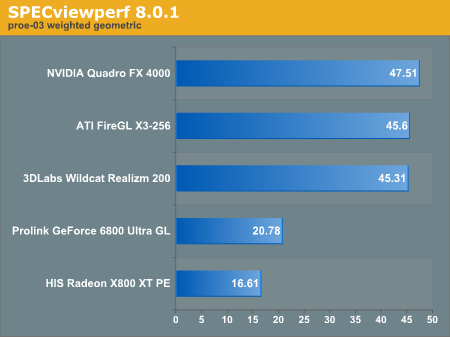
Pro/ENGINEER (proe-03)
"The proe-03 viewset was created from traces of the graphics workload generated by the Pro/ENGINEER 2001TM application from PTC.This is an absolutely huge test in terms of data and workload placed on the cards. The Quadro FX 4000 leads here, but the 3 workstation cards really are close and excel in different areas. Check out the table and see what we mean.
Two models and three rendering modes are measured during the test. PTC contributed the models to SPEC for use in measurement of the Pro/ENGINEER application. The first of the models, the PTC World Car, represents a large-model workload composed of 3.9 to 5.9 million vertices. This model is measured in shaded, hidden-line removal, and wireframe modes. The wireframe workloads are measured both in normal and antialiased mode. The second model is a copier. It is a medium-sized model made up of 485,000 to 1.6 million vertices. Shaded and hidden-line-removal modes were measured for this model.
This viewset includes state changes as made by the application throughout the rendering of the model, including matrix, material, light and line-stipple changes. The PTC World Car shaded frames include more than 100MB of state and vertex information per frame. All state changes are derived from a trace of the running application. The state changes put considerably more stress on graphics subsystems than the simple geometry dumps found in older viewsets.
Mirroring the application, draw arrays are used for the shaded tests and immediate mode is used for the wireframe. The gradient background used by the Pro/E application is also included to model the application workload better."
Tests 1, 2 and 3 are clearly led by the FireGL X3-256. Unfortunately for ATI, the rest of the tests fall very short. The Wildcat Realizm 200 is much closer to the Quadro FX 4000 than it appears in the overall result. It leads 3 out of 7 benchmarks and is close in two of its losses. Test number 6 really pushes the Quadro up in score. It is data like this that gets lost in geometric means sometimes.
| SPECviewperf 8.0.1 proe-03 | |||||||
| 1 | 2 | 3 | 4 | 5 | 6 | 7 | |
| Quadro FX 4000 | 26.6 | 31 | 24.9 | 53.4 | 53.2 | 170 | 52.6 |
| Wildcat Realizm 200 | 27.1 | 31.8 | 24.5 | 54.2 | 45.2 | 143 | 51.3 |
| FireGL X3-256 | 38.3 | 45.9 | 31.7 | 38.4 | 36 | 135 | 42.9 |
| GeForce 6800 U GC | 11.2 | 13.1 | 15.3 | 33.5 | 8.55 | 88.5 | 32.7 |
| Radeon X800 XTPE | 7.33 | 8.63 | 9.05 | 22.7 | 22.5 | 44.2 | 23.8 |
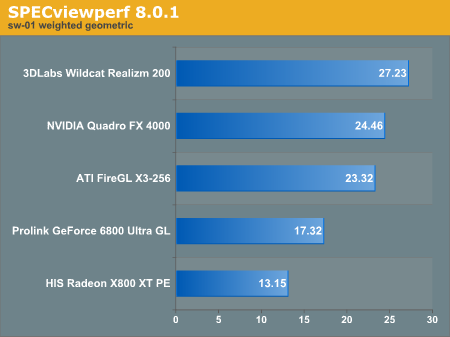
SolidWorks Viewset (sw-01)
"The sw-01 viewset was created from traces of the graphics workload generated by the Solidworks 2004 application from Dassault Systemes.The Realizm 200 comes out on top again in this benchmark, followed by the Quadro FX 4000, with the ATI card bringing up the rear. Here, we see a situation similar to the proe test when we look at the table of data.
The model and workloads used were contributed by Solidworks as part of the SPECapc for SolidWorks 2004 benchmark.
State changes as made by the application are included throughout the rendering of the model, including matrix, material, light and line-stipple changes. All state changes are derived from a trace of the running application. The state changes put considerably more stress on graphics subsystems than the simple geometry dumps found in older viewsets.
Mirroring the application, draw arrays are used for some tests and immediate mode used for others."
The Quadro FX 4000 leads in tests 2, 3, and 4. Test 7 is really what causes the major dichotomy in scoring between the two parts in the overall test. The Wildcat Realizm 200 is still the better part for the job under the SolidWords viewset, but it's good to step back and take a look at the individual test data.
| SPECviewperf 8.0.1 sw-01 | ||||||||
| 1 | 2 | 3 | 4 | 5 | 6 | 7 | 8 | |
| Quadro FX 4000 | 34.4 | 12.4 | 14.2 | 17.2 | 40.5 | 28.9 | 49.3 | 21.3 |
| Wildcat Realizm 200 | 43.4 | 9.76 | 12.6 | 15.5 | 48 | 32.7 | 103 | 22.6 |
| FireGL X3-256 | 26.6 | 12.1 | 15.3 | 18.5 | 39.5 | 25.5 | 52.4 | 18.2 |
| GeForce 6800 U GC | 31.8 | 10.6 | 10.6 | 13.8 | 32.8 | 12.2 | 33.4 | 12.3 |
| Radeon X800 XTPE | 23.7 | 6.04 | 6.37 | 8.04 | 18.3 | 11.5 | 52.1 | 11.1 |
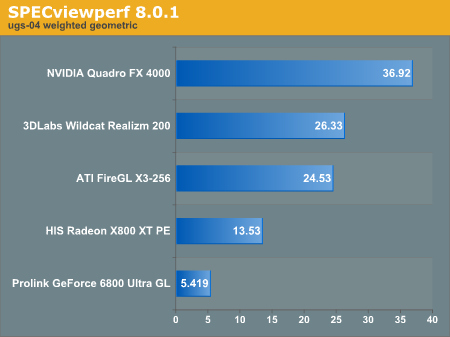
Unigraphics (ugs-04)
"The ugs-04 viewset was created from traces of the graphics workload generated by Unigraphics V17.The NVIDIA workstation solution is much better able to handle this workload. The huge models with shaded with transparencies turned on are easily rendered on the Quadro FX 4000.
The engine model used was taken from the SPECapc for Unigraphics V17 application benchmark. Three rendering modes are measured: shaded, shaded with transparency, and wireframe. The wireframe workloads are measured both in normal and anti-alised mode. All tests are repeated twice, rotating once in the center of the screen and then moving about the frame to measure clipping performance.
The viewset is based on a trace of the running application and includes all the state changes found during normal Unigraphics operation. As with the application, OpenGL display lists are used to transfer data to the graphics subsystem. Thousands of display lists of varying sizes go into generating each frame of the model.
To increase model size and complexity, SPECviewperf 8.0 replicates the model two times more than the previous ugs-03 test."
| SPECviewperf 8.0.1 ugs-04 | ||||||||
| 1 | 2 | 3 | 4 | 5 | 6 | 7 | 8 | |
| Quadro FX 4000 | 30.1 | 34.7 | 27.8 | 31.2 | 51 | 62.2 | 47.5 | 49.8 |
| Wildcat Realizm 200 | 24.3 | 26.8 | 22 | 23.2 | 38.8 | 31.4 | 30.2 | 26.7 |
| FireGL X3-256 | 18.5 | 19.1 | 13.9 | 14.4 | 53.4 | 56.4 | 53.7 | 53.3 |
| GeForce 6800 U GC | 3.29 | 3.86 | 3.01 | 3.52 | 27.3 | 31.9 | 4.94 | 7.38 |
| Radeon X800 XTPE | 11.9 | 12 | 9.13 | 9.13 | 22.2 | 22.6 | 22.2 | 22.4 |
To sum up SPECviewperf 8.0.1 Performance, we have the FireGL X3-256 Leading 1 benchmark (ensight), the Wildcat Realism 200 leading 2 benchmarks (3dsmax, sw), and the Quadro FX 4000 taking pole position on the other 5 tests.
Now, let's put the cards to the test inside applications and see if performance holds up.


25 Comments
View All Comments
DerekWilson - Thursday, December 23, 2004 - link
johnsonx,thanks for the suggestion. we're definitly exploring options for other workstation articles.
since this is the first of the graphics workstation articles we've tackled in quite a while, we wanted to start with current technology (R4xx, NV4x, and WC Realizm based parts). There aren't curently lower end parts (with the exception of the Wildcat Realizm 100) based on the technology we tested for this article.
thanks again. let us know if there's anything else we can look into doing for future reviews.
Derek Wilson
johnsonx - Thursday, December 23, 2004 - link
How about benchmarking some of the lower Quadro and FireGL cards? ATI has the FireGL 9600 (aka FireGL T2-128), FireGL 9700 (aka FireGL X1), and FireGL 9800 (aka FireGL X2-256t) at $250, $500 and $600 price points repectively. Comparable Quadros are available as well.For many professional uses, a workstation class card (with attendant workstation class, certified drives) is desired, but ultra-high performance isn't important. It'd be nice to see the comparitive performance of the lower end cards.
DerekWilson - Thursday, December 23, 2004 - link
ksherman,You may have some luck with the 6600gt under AutoCAD, espeically if you don't intend to push the graphics subsystem as much as we did (no AA lines, less tess, etc...), but depending on the Pro/E workload, you may have trouble.
The SPECviewperf veiwset tests a much larger workload than the OCUS benchmark. If you're working with smaller data, you should be fine, but if we're talking millions of verts, you're going to have increasing ammounts of trouble with a 128MB card.
Derek Wilson
ksherman - Thursday, December 23, 2004 - link
You guys should throw in a few mainstream graphics cards for comparison. I am trying to build a systems whos primary use will be with Pro/Engineer and AutoCAD and i certainly do not have the money for a $1000+ video card. Im just wondering how the other cards match up (like the 6600gt AGP)Speedo - Thursday, December 23, 2004 - link
Nice review!