Intel Xeon 3.6 (Nocona) vs. AMD Opteron 250 - Database Test
by Jason Clark & Ross Whitehead on September 13, 2004 12:05 AM EST- Posted in
- IT Computing
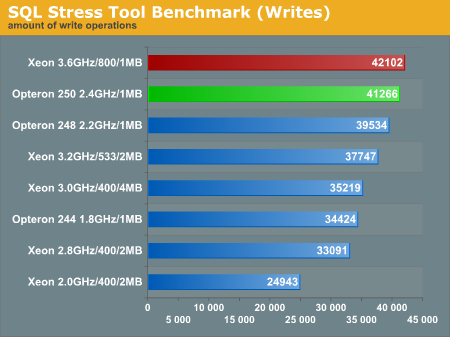
AnandTech Forums Database Test Results
It appears that the front side bus increase for the Nocona has helped performance quite a bit with this workload; an 11% increase in performance (over the 3.2GHz Prestonia Xeon) for a 12.5% increase in clock speed is quite good. The difference in performance between the Opteron 250 and the Nocona 3.6 is approximately 2%, which is also our tolerance for deviation between test runs. For this test, we'd have to call it a draw between the Opteron and Nocona.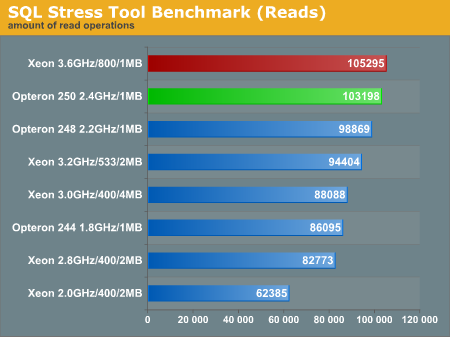
Constructing a Database Benchmark (average load)
"Order Entry" Stress Test: Measuring Enterprise Class Performance


44 Comments
View All Comments
knitecrow - Monday, September 13, 2004 - link
Something caught my eye:"The difference in performance between the Opteron 250 and the Nocona 3.6 is approximately 2%, which is also our tolerance for deviation between test runs."
I know its an unfair charge to level against this site, as everyone does it, but why aren't there any error bars?
In my freshman physics class they really made the point that graphs with out error bars are useless.... and the work was rubbish.
Just by looking at the graph I can't tell the variance or the margin of error. Wouldn't it be helpful if we had the information?
Anyway, just a thought.
saechaka - Monday, September 13, 2004 - link
the message is clear the beat must go onMAME - Monday, September 13, 2004 - link
AMD > Intel once againShadowmage - Monday, September 13, 2004 - link
The Opteron applies extreme beats yet again! :D