The AMD 3rd Gen Ryzen Deep Dive Review: 3700X and 3900X Raising The Bar
by Andrei Frumusanu & Gavin Bonshor on July 7, 2019 9:00 AM EST** = Old results marked were performed with the original BIOS & boost behaviour as published on 7/7.
Benchmarking Performance: CPU Encoding Tests
With the rise of streaming, vlogs, and video content as a whole, encoding and transcoding tests are becoming ever more important. Not only are more home users and gamers needing to convert video files into something more manageable, for streaming or archival purposes, but the servers that manage the output also manage around data and log files with compression and decompression. Our encoding tasks are focused around these important scenarios, with input from the community for the best implementation of real-world testing.
All of our benchmark results can also be found in our benchmark engine, Bench.
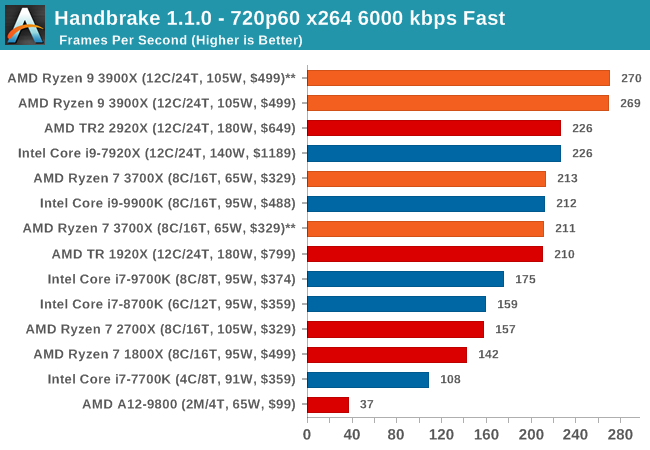
Handbrake 1.1.0: Streaming and Archival Video Transcoding
A popular open source tool, Handbrake is the anything-to-anything video conversion software that a number of people use as a reference point. The danger is always on version numbers and optimization, for example the latest versions of the software can take advantage of AVX-512 and OpenCL to accelerate certain types of transcoding and algorithms. The version we use here is a pure CPU play, with common transcoding variations.
We have split Handbrake up into several tests, using a Logitech C920 1080p60 native webcam recording (essentially a streamer recording), and convert them into two types of streaming formats and one for archival. The output settings used are:
- 720p60 at 6000 kbps constant bit rate, fast setting, high profile
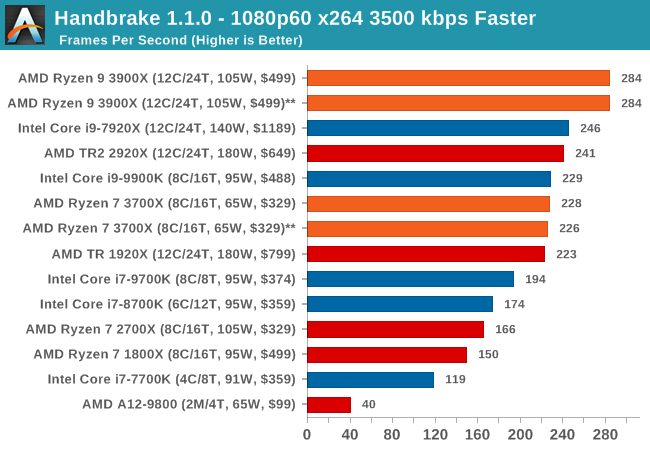
- 1080p60 at 3500 kbps constant bit rate, faster setting, main profile
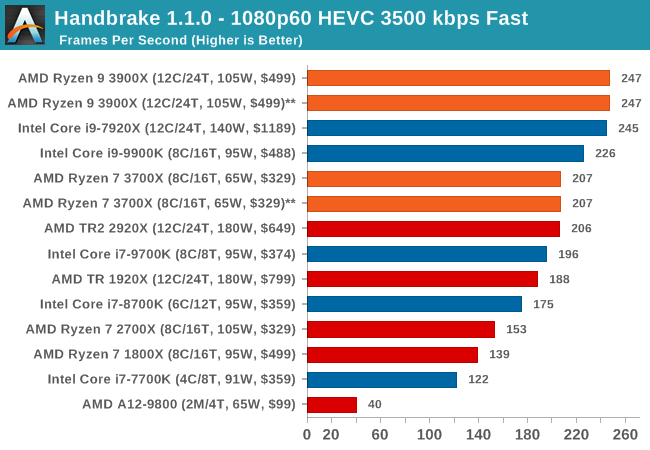
- 1080p60 HEVC at 3500 kbps variable bit rate, fast setting, main profile
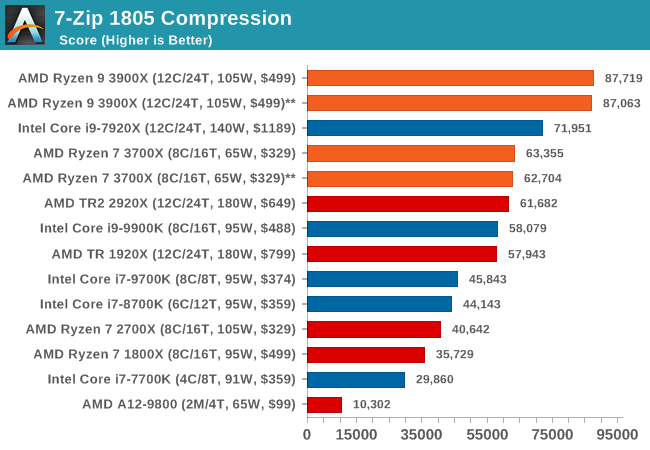
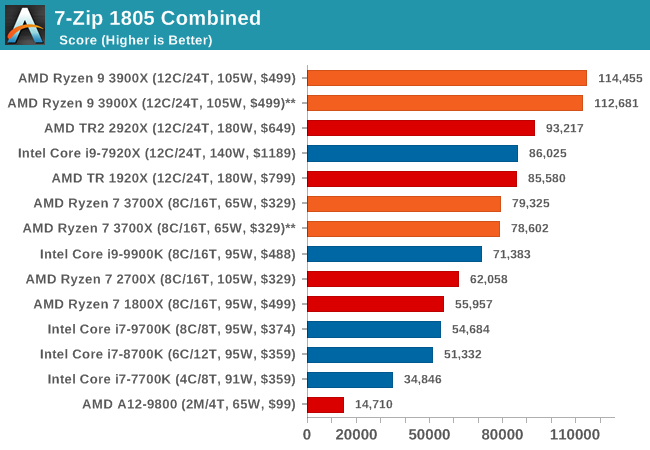
7-zip v1805: Popular Open-Source Encoding Engine
Out of our compression/decompression tool tests, 7-zip is the most requested and comes with a built-in benchmark. For our test suite, we’ve pulled the latest version of the software and we run the benchmark from the command line, reporting the compression, decompression, and a combined score.
It is noted in this benchmark that the latest multi-die processors have very bi-modal performance between compression and decompression, performing well in one and badly in the other. There are also discussions around how the Windows Scheduler is implementing every thread. As we get more results, it will be interesting to see how this plays out.
(Please note, if you plan to share the Compression graph, we'd appreciate it if you could please include the Decompression graph as well. Otherwise you’re only presenting half of the picture)

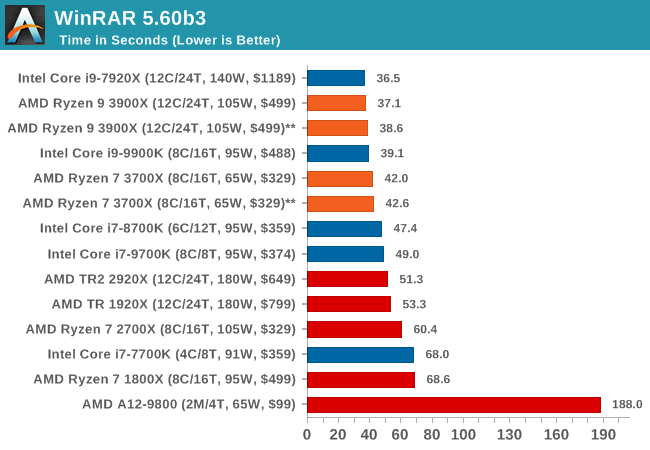
WinRAR 5.60b3: Archiving Tool
My compression tool of choice is often WinRAR, having been one of the first tools a number of my generation used over two decades ago. The interface has not changed much, although the integration with Windows right click commands is always a plus. It has no in-built test, so we run a compression over a set directory containing over thirty 60-second video files and 2000 small web-based files at a normal compression rate.
WinRAR is variable threaded but also susceptible to caching, so in our test we run it 10 times and take the average of the last five, leaving the test purely for raw CPU compute performance.
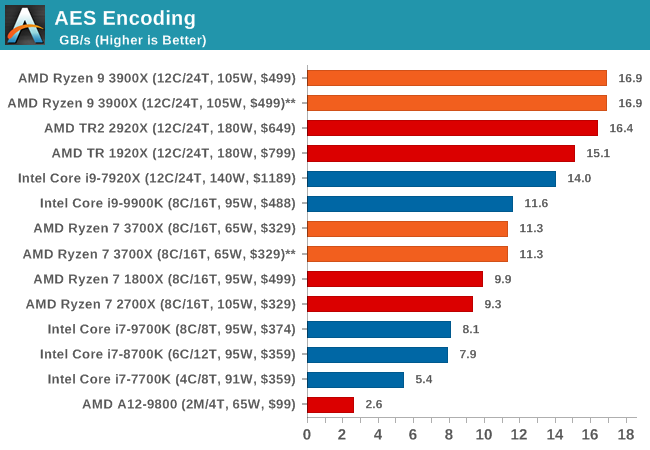
AES Encryption: File Security
A number of platforms, particularly mobile devices, are now offering encryption by default with file systems in order to protect the contents. Windows based devices have these options as well, often applied by BitLocker or third-party software. In our AES encryption test, we used the discontinued TrueCrypt for its built-in benchmark, which tests several encryption algorithms directly in memory.
The data we take for this test is the combined AES encrypt/decrypt performance, measured in gigabytes per second. The software does use AES commands for processors that offer hardware selection, however not AVX-512.


447 Comments
View All Comments
Maxiking - Tuesday, July 23, 2019 - link
I said a few times... I don't tend to buy amd products so no, I am not gonna sue anybody.And as pointed out in the video, in his German one, he works for a retailer selling prebuilt pcs.. People keep returning pcs with AMD cpus becaue they do not boost to the promised frequency. You there, there are something like laws, if you write on the box 4.6ghz, it must reach it.
You are so knowledgeable, sharp minded and analytical when comes to meaning of words and what people want to say, you should sue Intel on your own, should be easy.
Atom2 - Monday, July 29, 2019 - link
ICC compiler is 3x faster than LLVM and AVX512 is 2x faster than AVX2. And both were left out of comparison? The comparison designed purely only for the LLVM compiler users? Used by who?Rudde - Saturday, August 10, 2019 - link
ICC is proprietary afaik and Anandtech prefers open compilers. AVX512 should be found in 3DPM and shows utter demolition by the only processor that supports it (7920X).MasterE - Wednesday, August 7, 2019 - link
I considered going with the Ryzen 9 3900X chip and an x570 motherboard for a new rendering system but since these chips aren't available for less than $820+ anywhere, I guess I'll be back to either the threadripper or Intel 9000+ series. There is simply no way I'm paying that kind of price for a chip with a Manufacters Suggested Retail Price of $499.gglaw - Friday, August 23, 2019 - link
@Andrei - I was just digging through reviews again before biting the bullet on a 3900X and one of the big questions that is not agreed upon in the tech community is gaming performance for PBO vs all-core overclock, yet you only run 2 benches on the overclocked settings. How can a review be complete with only 2 benches run, neither related to gaming? In a PURELY single threaded scenario PBO gives a tiny 2.X percent increase in single threaded Cinebench. This indicates to me that it is not sustaining the max 4.6 on a single core or it would have scaled better, so it may not be really comparing 4.6 vs 4.3 even for single threaded performance. Almost all recent game engines can at least utilize 4 threads, so I feel your exact same test run through the gaming suite would have shown a consistent winner with 4.3 all-core OC vs PBO. And in heavily threaded scenarios the gap would keep growing larger, but specifically in today's GAMES, especially if you consider very few of us have 0 background activity, all-core OC would hands-down win is my guess, but we could have better evidence of this if you could run a complete benchmarking suite. (unless I'm blind and missed it, in case my apologies :)I've been messing around with a 3700X, and even with a 14cm Noctua cooling it, it does not sustain max allowed boost on even a single core with PBO which is another thing I wish you touched on more. During your testing do you monitor the boost speeds and what percent of the time it can stay at the max boost over XX minutes?
Maxiking - Monday, August 26, 2019 - link
Veni, vidi viciYeah, I was right.
I would like to thank my family for all the support I have received whilst fighting amd fanboys.
It was difficult, sometimes I was seriously thinking about giving up but the truth can not be stopped!
The AMD fraud has been confirmed.
https://www.reddit.com/r/pcgaming/comments/cusn2t/...
Ninjawithagun - Thursday, October 10, 2019 - link
Now all you have to do is have all these benchmarks ran again after applying the 1.0.0.3. ABBA BIOS update ;-)quadibloc - Tuesday, November 12, 2019 - link
I am confused by the diagram of the current used by individual cores as the number of threads is increased. Since SMT doesn't double the performance of a core, on the 3900X, for example, shouldn't the number of cores in use increase to all 12 for the first 12 threads, one core for each thread, with all cores then remaining in use as the number of threads continues to increase to 24?Or is it just that this chart represents power consumption under a particular setting that minimizes the number of cores in use, and other settings that maximize performance are also possible?
SjLeonardo - Saturday, December 14, 2019 - link
Core and uncore get supplied by different VRMs, right?Parkab0y - Sunday, October 4, 2020 - link
I really want to see something like this about zen3 5000