The AMD Ryzen Threadripper 1950X and 1920X Review: CPUs on Steroids
by Ian Cutress on August 10, 2017 9:00 AM ESTCPU Web Tests
One of the issues when running web-based tests is the nature of modern browsers to automatically install updates. This means any sustained period of benchmarking will invariably fall foul of the 'it's updated beyond the state of comparison' rule, especially when browsers will update if you give them half a second to think about it. Despite this, we were able to find a series of commands to create an un-updatable version of Chrome 56 for our 2017 test suite. While this means we might not be on the bleeding edge of the latest browser, it makes the scores between CPUs comparable.
All of our benchmark results can also be found in our benchmark engine, Bench.
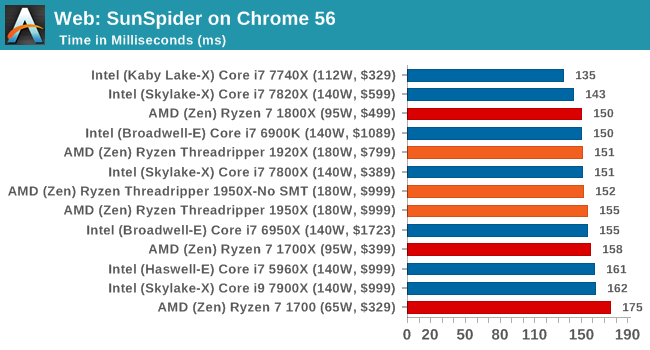
SunSpider 1.0.2: link
The oldest web-based benchmark in this portion of our test is SunSpider. This is a very basic javascript algorithm tool, and ends up being more a measure of IPC and latency than anything else, with most high-performance CPUs scoring around about the same. The basic test is looped 10 times and the average taken. We run the basic test 4 times.
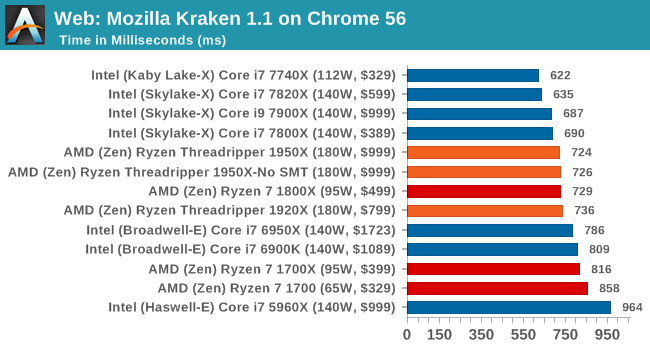
Mozilla Kraken 1.1: link
Kraken is another Javascript based benchmark, using the same test harness as SunSpider, but focusing on more stringent real-world use cases and libraries, such as audio processing and image filters. Again, the basic test is looped ten times, and we run the basic test four times.
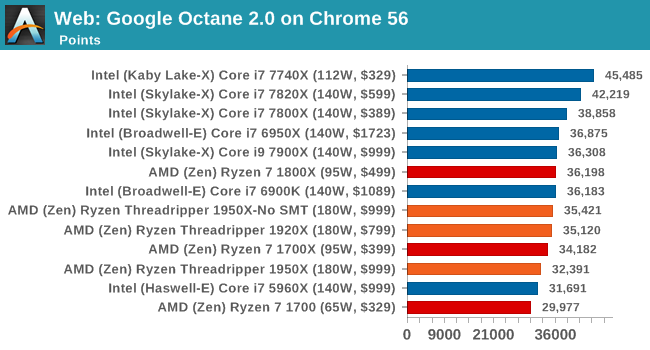
Google Octane 2.0: link
Along with Mozilla, as Google is a major browser developer, having peak JS performance is typically a critical asset when comparing against the other OS developers. In the same way that SunSpider is a very early JS benchmark, and Kraken is a bit newer, Octane aims to be more relevant to real workloads, especially in power constrained devices such as smartphones and tablets.
WebXPRT 2015: link
While the previous three benchmarks do calculations in the background and represent a score, WebXPRT is designed to be a better interpretation of visual workloads that a professional user might have, such as browser based applications, graphing, image editing, sort/analysis, scientific analysis and financial tools.
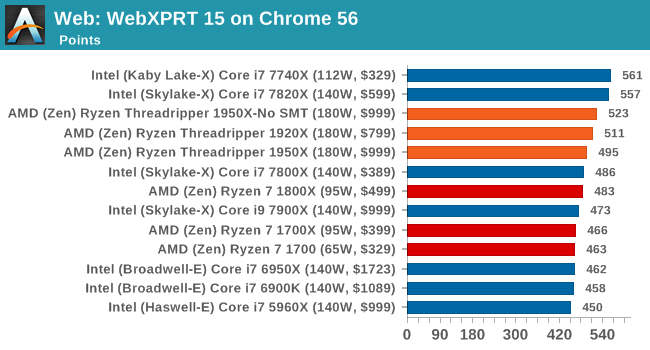
Overall, all of our web benchmarks show a similar trend. Very few web frameworks offer multi-threading – the browsers themselves are barely multi-threaded at times – so Threadripper's vast thread count is underutilized. What wins the day on the web are a handful of fast cores with high single-threaded performance.


347 Comments
View All Comments
blublub - Sunday, August 13, 2017 - link
From what I have read is that all TR do 3.9hhz and some even 4-4.1ghz on all cores .What are your temp when running all 10c @4.6ghz prime for 1-2hrs
Zingam - Sunday, August 13, 2017 - link
Ian, how about testing mobile CPUs - for games and for office work. Aren't mobile CPUs selling much larger numbers thatn desktop ones these days?I can't find a single benchmark comparing i5-7300hq vs i7-7700hq vs i7-7700K showing the difference in productivity workloads and not just for rendering pretty pictures but also for more specific tasks as compiling software etc.
I also would like to see some sort of comparison of new generation to all generations upto 10 years back in time. I'd like to know how much did performance increase since the age of Nehelem. At least from now on there should be a single test to display the relative performance increase over the last few generations. The average user doesn't upgrade their PC every year. The average user maybe upgrades every 5 years and it is really difficult to find out how much peformance increase would one get with an upgrade.
SanX - Sunday, August 13, 2017 - link
I agree, there must be 5-7 years old processors in the chartsSanX - Sunday, August 13, 2017 - link
Why one core of Apple A10 costs $10 but one core of Intel 7900x costs 10x more?oranos - Sunday, August 13, 2017 - link
so its complete dogsh*t for the segment which is driving the PC market right now: gaming. got it.ballsystemlord - Sunday, August 13, 2017 - link
Hey Ian, you've been talking about anandtech's great database where we can see all the cool info. Well, according to your database the Phenom II 6 core 1090T is equally powerful when compared to the 16 core threadripper!!!!!!! http://www.anandtech.com/bench/product/1932?vs=146With those sorts of numbers why would anyone plan an upgrade?
(And there is also only one metric displayed, strange!)
Not to play the Intel card on you as others do, but this is a serious problem for at least the AMD lineup of processors.
jmelgaard - Monday, August 14, 2017 - link
o.O... I don't know how you derived that conclusion? you need a guide on how to read the database?...BurntMyBacon - Monday, August 14, 2017 - link
For anyone looking for an overall fps for two pass encoding here is your equation (hope my math is correct):FPS = 2*FPS1*FPS2/(FPS2+FPS1)
No, you can't just average the FPS scores from each pass as the processor will spend more time in the slower pass.
For the x264 encoding test, for example, a few relevant FPS scores end up being:
i9-7900X: 122.56
i7-7820X: 114.37
i7-6900K: 95.26
i7-7740X: 82.74
TR-1950X: 118.13
TR-1950X(g): 117.00
TR-1920X: 111.74
R7-1800X: 100.19
Since two pass encoding requires both passes to be usable, getting an overall FPS score seems somewhat relevant. Alternately, using time to completion is would present the same information in a different manner. Though, it would be difficult to extrapolate performance results to estimate performance in other encodes without also posting the number of frames encoded.
goldgrenade - Thursday, January 4, 2018 - link
Take all those Intel FPS performance counters and multiply them by .7 and you have what their chips actually run at without a major security flaw in them.Let's see that would be...
i9-7900X: 85.792
i7-7820X: 80.059
i7-6900K: 66.682
i7-7740X: 57.918
And that's at best. It can be up to 50% degradation when rendering or having to do many small file accesses or repeated operations with KAISER.
Gastec - Tuesday, August 15, 2017 - link
I've having a hard time trying to swallow "Threadripper is a consumer focused product" line considering the prices to "consume" it: $550 for the MB, $550 for the TR1900X ($800 or $1000 for the others is just dreaming) then the RAM. The MB(at least the Asus one) should be $200 less, but I get it, they are trying to squeeze as much as possible from the...consumers. Now don't get me wrong and I mean no offence for the rich ones among you, but those CPU are for Workstations. WORK, not gamestations. Meaning you would need them to help you make your money, faster.