The AMD Ryzen Threadripper 1950X and 1920X Review: CPUs on Steroids
by Ian Cutress on August 10, 2017 9:00 AM ESTAshes of the Singularity Escalation
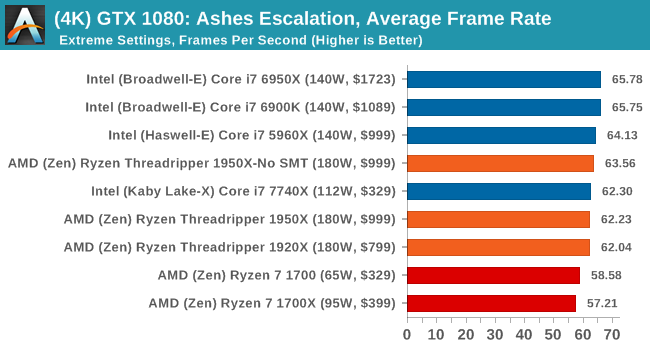
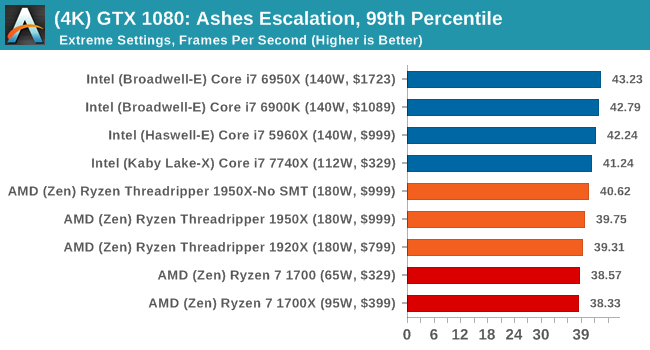
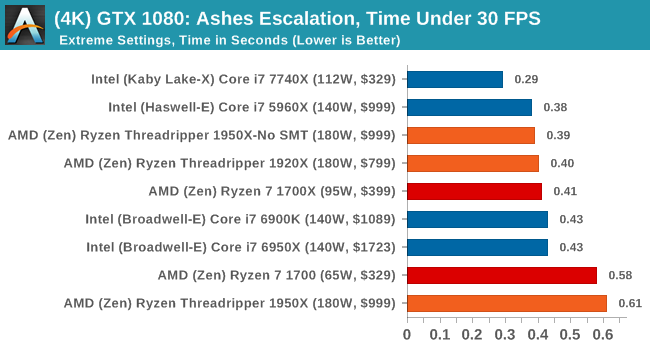
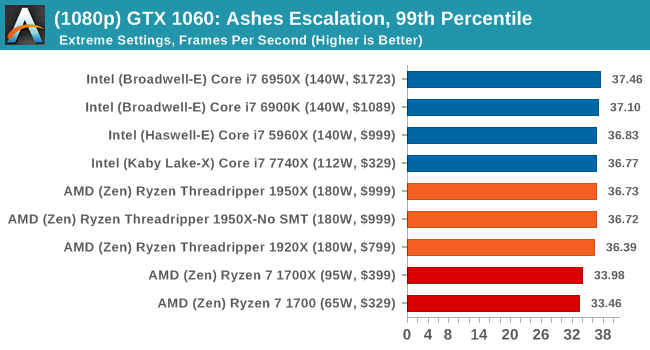
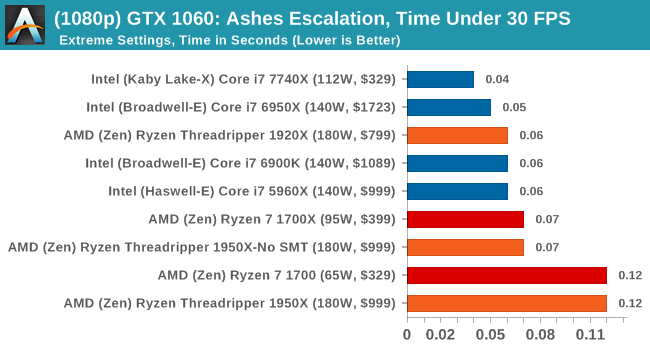
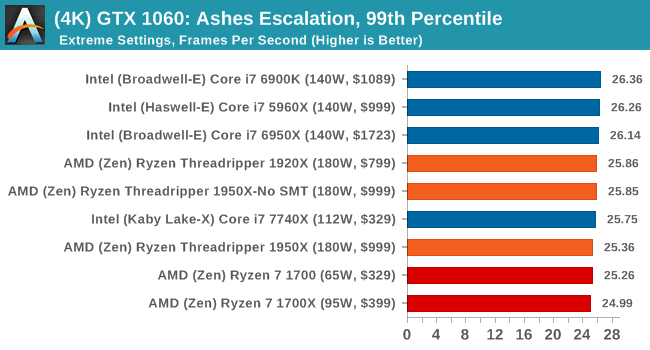
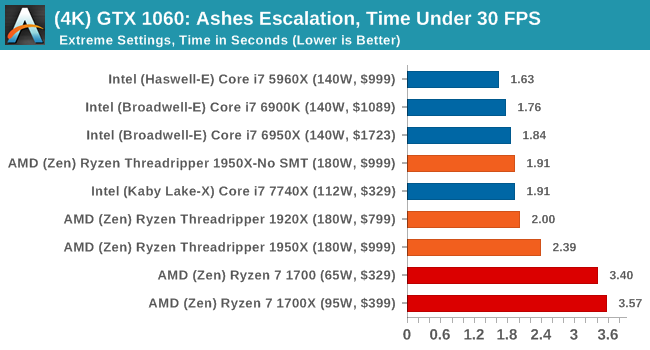
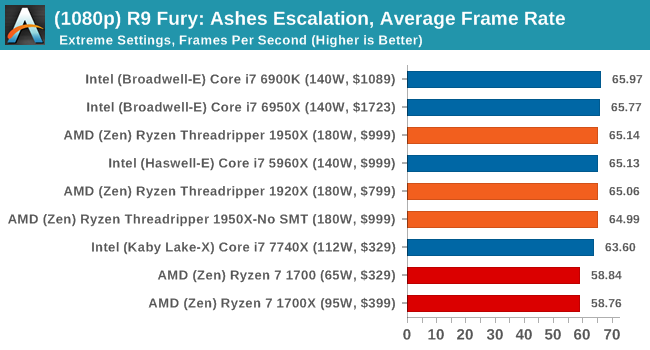
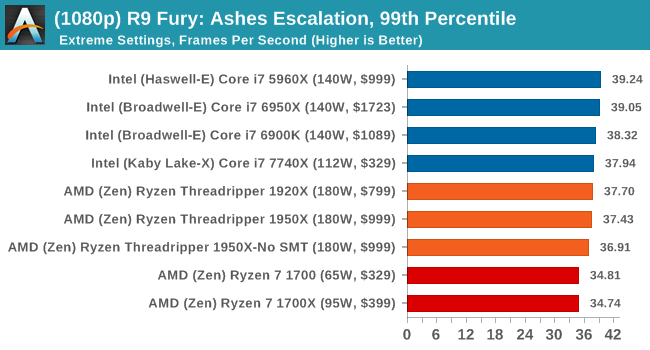
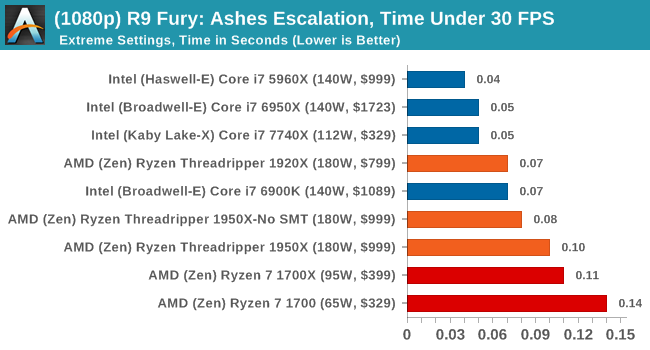
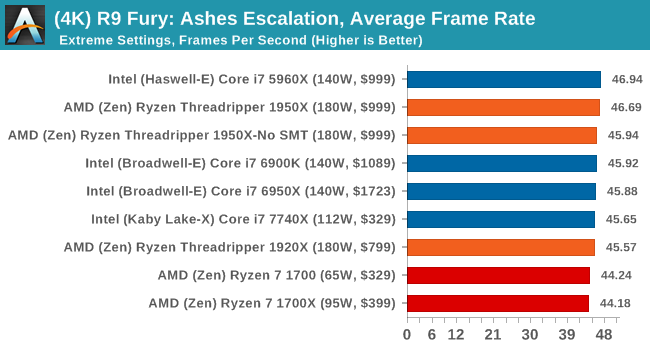
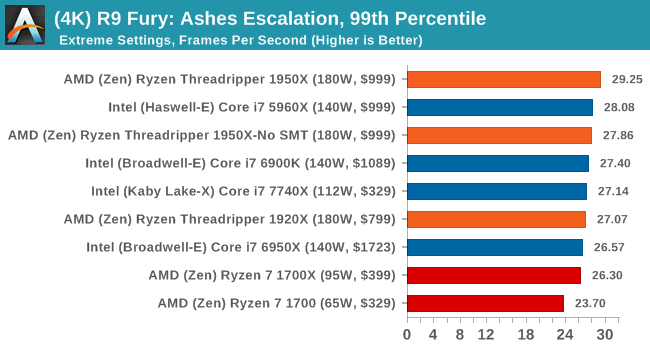
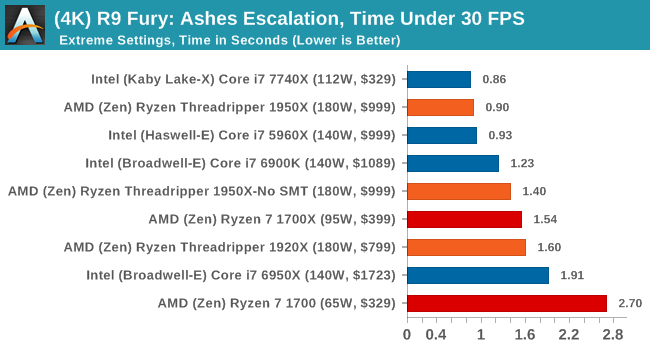
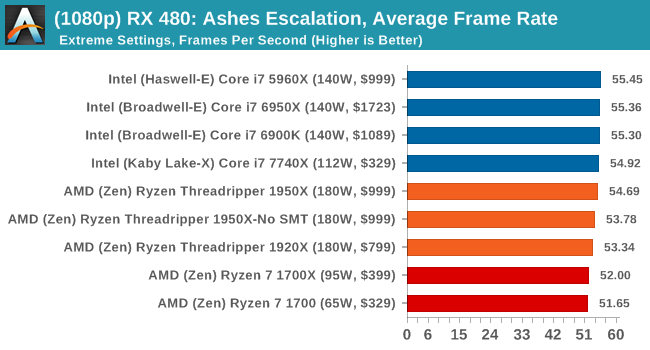
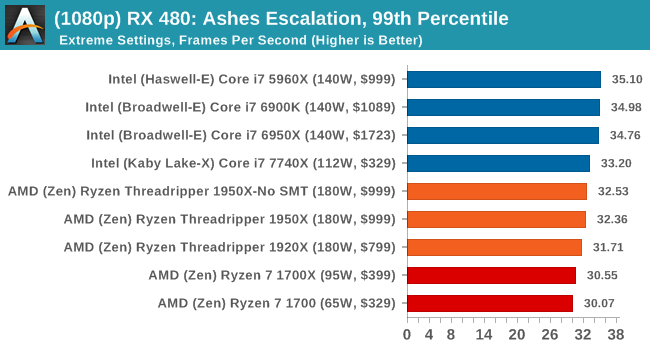
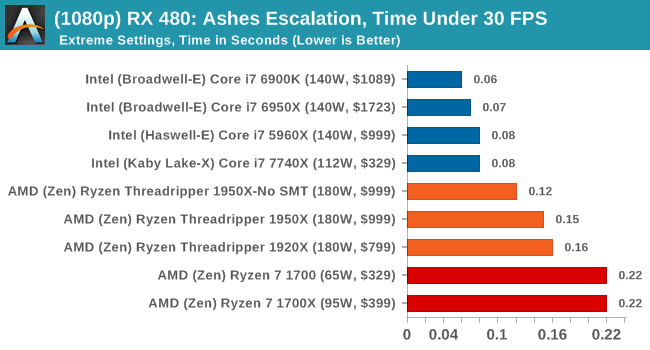
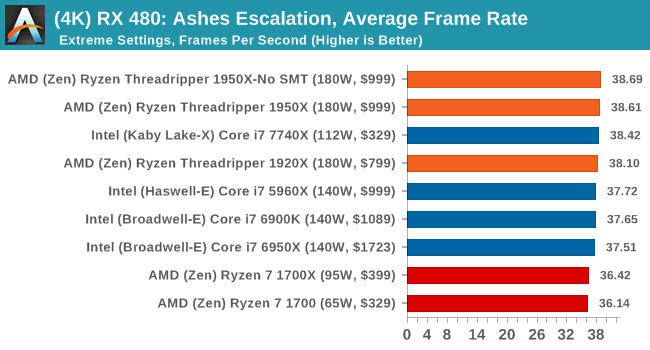
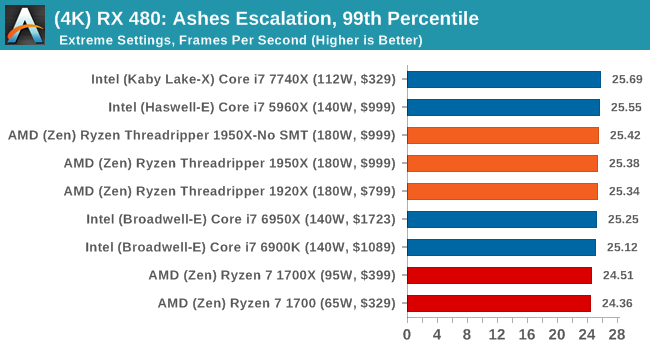
Seen as the holy child of DirectX12, Ashes of the Singularity (AoTS, or just Ashes) has been the first title to actively go explore as many of DirectX12s features as it possibly can. Stardock, the developer behind the Nitrous engine which powers the game, has ensured that the real-time strategy title takes advantage of multiple cores and multiple graphics cards, in as many configurations as possible.

As a real-time strategy title, Ashes is all about responsiveness during both wide open shots but also concentrated battles. With DirectX12 at the helm, the ability to implement more draw calls per second allows the engine to work with substantial unit depth and effects that other RTS titles had to rely on combined draw calls to achieve, making some combined unit structures ultimately very rigid.
Stardock clearly understand the importance of an in-game benchmark, ensuring that such a tool was available and capable from day one, especially with all the additional DX12 features used and being able to characterize how they affected the title for the developer was important. The in-game benchmark performs a four minute fixed seed battle environment with a variety of shots, and outputs a vast amount of data to analyze.
For our benchmark, we run a fixed v2.11 version of the game due to some peculiarities of the splash screen added after the merger with the standalone Escalation expansion, and have an automated tool to call the benchmark on the command line. (Prior to v2.11, the benchmark also supported 8K/16K testing, however v2.11 has odd behavior which nukes this.)
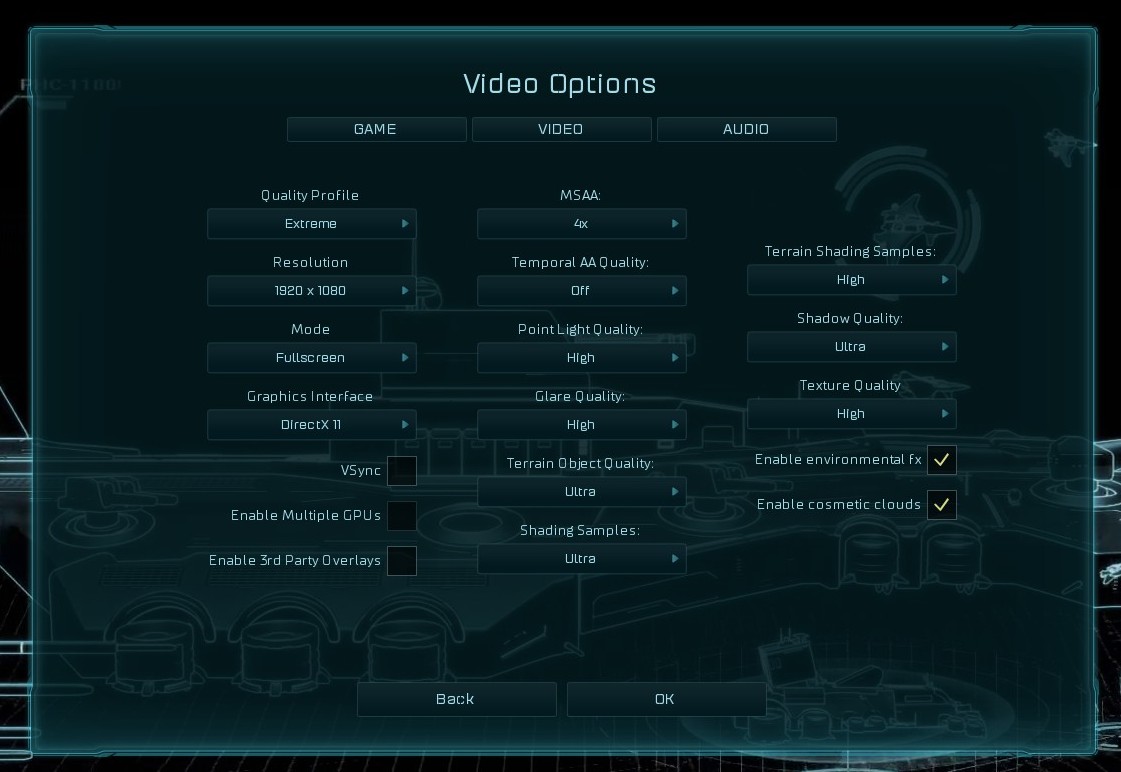
At both 1920x1080 and 4K resolutions, we run the same settings. Ashes has dropdown options for MSAA, Light Quality, Object Quality, Shading Samples, Shadow Quality, Textures, and separate options for the terrain. There are several presents, from Very Low to Extreme: we run our benchmarks at Extreme settings, and take the frame-time output for our average, percentile, and time under analysis.
All of our benchmark results can also be found in our benchmark engine, Bench.
MSI GTX 1080 Gaming 8G Performance
1080p
4K
ASUS GTX 1060 Strix 6G Performance

1080p
4K

Sapphire Nitro R9 Fury 4G Performance
1080p
4K
Sapphire Nitro RX 480 8G Performance
1080p
4K
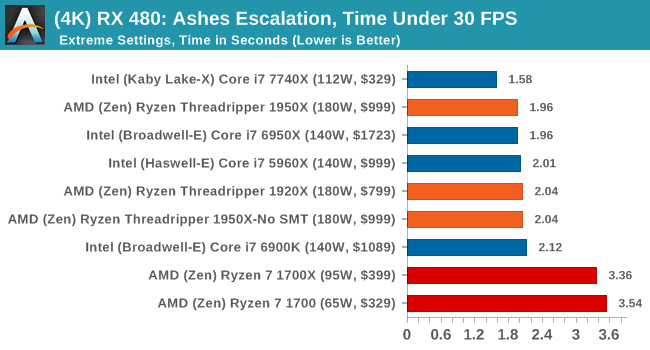
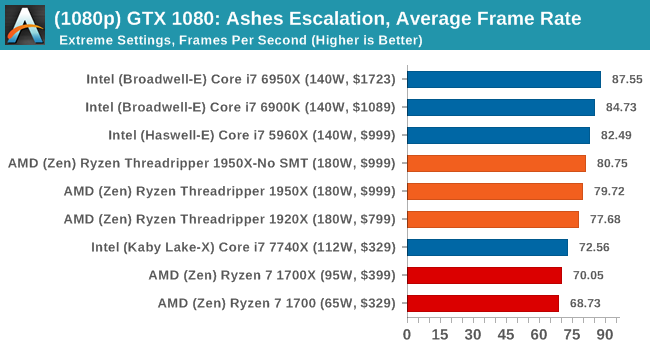
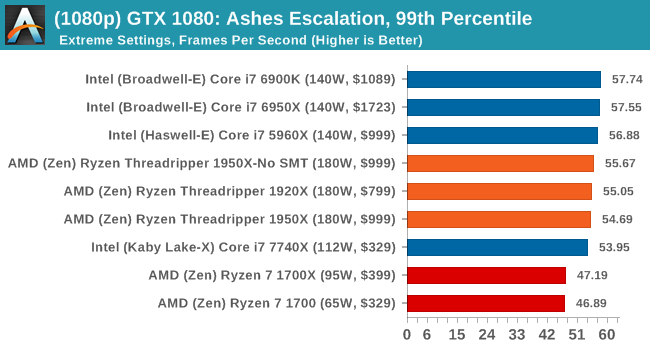
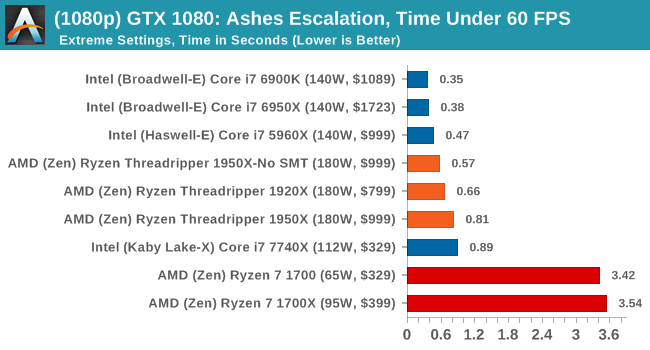
AMD gets in the mix a lot with these tests, and in a number of cases pulls ahead of the Ryzen chips in the Time Under analysis.


347 Comments
View All Comments
coolhardware - Saturday, August 12, 2017 - link
Hi B3an, what will you primarily be using your 1950X for?I do not really have the workload to justify that CPU, but I wish I did ;-)
Mugur - Sunday, August 13, 2017 - link
I suggest you to read other TR reviews. Some were testing GPU rendering and they show that even in this case you need the best cpu you can get.minde - Saturday, August 12, 2017 - link
i see in foto on amd processor MADE IN CHINA . without comment. what differencebetween intel and amd quality , class
mr_tawan - Saturday, August 12, 2017 - link
TSMC perhaps?tuxRoller - Saturday, August 12, 2017 - link
I'm very curious as to how this will perform with smt enabled and numa being exposed.franzeal - Saturday, August 12, 2017 - link
On page 1, does Ryzen use an AMD implementation of SMT or hyper-threading (i.e. licensed from Intel). I've been under the impression it's the former, and referring to SMT as hyper-threading in this instance is incorrect. Intel's was not the first or the only way to implement SMT.Oxford Guy - Saturday, August 12, 2017 - link
When you went with 2400 speed RAM to slow down TR you forgot to make it single channel.franzeal - Saturday, August 12, 2017 - link
Error in Dolphin benchmark description: "Results are given in minutes, where the Wii itself scores 17.53 minutes." should be results are given in seconds.franzeal - Saturday, August 12, 2017 - link
On the last page it states "On the side of the 1920X, users will again see more cores, ECC support, and over double the number of PCIe lanes compared to the Core i7-7820X for $100 difference."According to the accompanying chart it's a ~$200 difference. Either the chart is wrong or that statement.
quadi9 - Saturday, August 12, 2017 - link
I picked up an I9-7900x at a local Micro Center for $899 this week. And it is running stable at 4.6 GHZ. How well does the Ryzen overclock? My Blender BMW score was 181 seconds. Just opened the file and clicked Render.