The AMD Ryzen Threadripper 1950X and 1920X Review: CPUs on Steroids
by Ian Cutress on August 10, 2017 9:00 AM ESTCPU System Tests
Our first set of tests is our general system tests. These set of tests are meant to emulate more about what people usually do on a system, like opening large files or processing small stacks of data. This is a bit different to our office testing, which uses more industry standard benchmarks, and a few of the benchmarks here are relatively new and different.
All of our benchmark results can also be found in our benchmark engine, Bench.
PDF Opening
First up is a self-penned test using a monstrous PDF we once received in advance of attending an event. While the PDF was only a single page, it had so many high-quality layers embedded it was taking north of 15 seconds to open and to gain control on the mid-range notebook I was using at the time. This put it as a great candidate for our 'let's open an obnoxious PDF' test. Here we use Adobe Reader DC, and disable all the update functionality within. The benchmark sets the screen to 1080p, opens the PDF to in fit-to-screen mode, and measures the time from sending the command to open the PDF until it is fully displayed and the user can take control of the software again. The test is repeated ten times, and the average time taken. Results are in milliseconds.
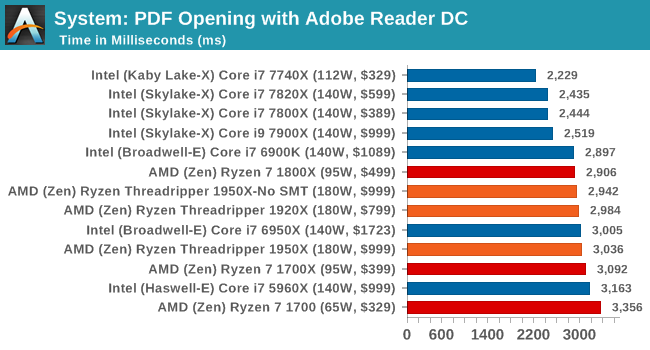
This opening test is single threaded, so the high-frequency Intel parts get a clear win. There's not much between the Threadripper CPUs here.
FCAT Processing: link
One of the more interesting workloads that has crossed our desks in recent quarters is FCAT - the tool we use to measure and visually analyze stuttering in gaming due to dropped or runt frames. The FCAT process requires enabling a color-based overlay onto a game, recording the gameplay, and then parsing the video file through the analysis software. The software is mostly single-threaded, however because the video is basically in a raw format, the file size is large and requires moving a lot of data around. For our test, we take a 90-second clip of the Rise of the Tomb Raider benchmark running on a GTX 980 Ti at 1440p, which comes in around 21 GB, and measure the time it takes to process through the visual analysis tool.
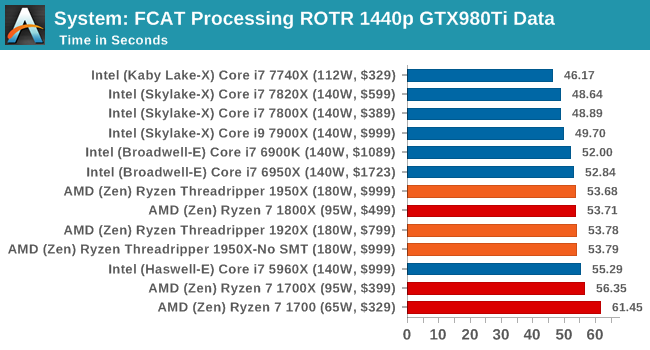
Similar to PDF opening, single threaded performance wins out.
Dolphin Benchmark: link
Many emulators are often bound by single thread CPU performance, and general reports tended to suggest that Haswell provided a significant boost to emulator performance. This benchmark runs a Wii program that ray traces a complex 3D scene inside the Dolphin Wii emulator. Performance on this benchmark is a good proxy of the speed of Dolphin CPU emulation, which is an intensive single core task using most aspects of a CPU. Results are given in minutes, where the Wii itself scores 17.53 minutes.
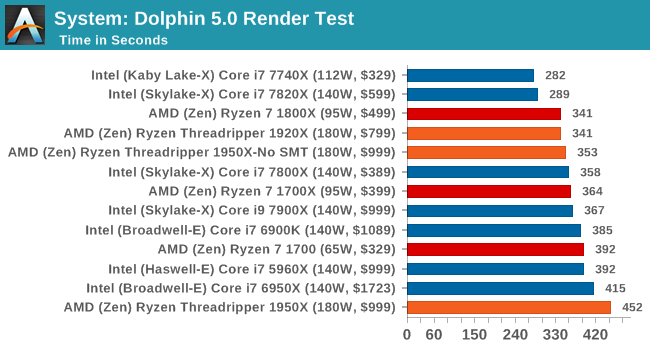
Dolphin likes single thread performance as well, although having some cores to back it up seems to be required.
3D Movement Algorithm Test v2.1: link
This is the latest version of the self-penned 3DPM benchmark. The goal of 3DPM is to simulate semi-optimized scientific algorithms taken directly from my doctorate thesis. Version 2.1 improves over 2.0 by passing the main particle structs by reference rather than by value, and decreasing the amount of double->float->double recasts the compiler was adding in. It affords a ~25% speed-up over v2.0, which means new data.
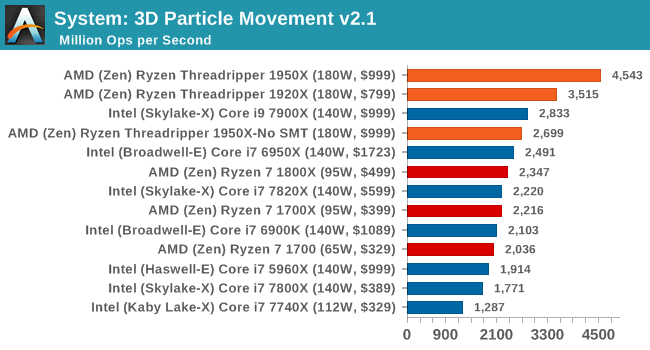
Our first pure multithreaded test, and the 1950X wins with 32 threads. The 1920X beats the 1950X in SMT-off mode, due to 24 threads beating 16 threads.
DigiCortex v1.20: link
Despite being a couple of years old, the DigiCortex software is a pet project for the visualization of neuron and synapse activity in the brain. The software comes with a variety of benchmark modes, and we take the small benchmark which runs a 32k neuron/1.8B synapse simulation. The results on the output are given as a fraction of whether the system can simulate in real-time, so anything above a value of one is suitable for real-time work. The benchmark offers a 'no firing synapse' mode, which in essence detects DRAM and bus speed, however we take the firing mode which adds CPU work with every firing.
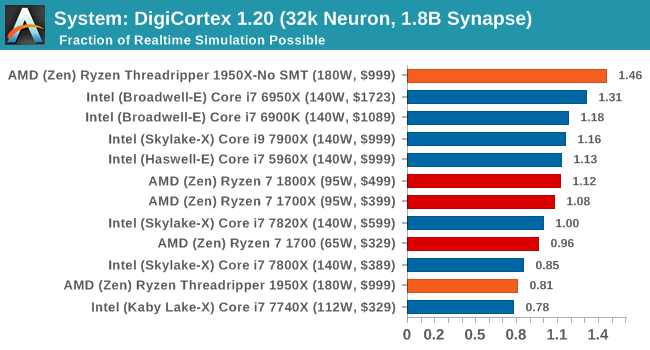
DigiCortex requires a mash of CPU frequency and DRAM performance to get a good result, and anything with quad-channel memory is usually preferred. The 1950X in SMT-off mode wins here due to its low main memory latency combined with having 16 threads to access it. The Broadwell-E is the nearest competitor, over Skylake-X, most likely due to the mesh vs ring topology. The 1950X in Creator mode scores way down the field however, lower than the standard Ryzen chips, showing that under a unified memory architecture there can be significant performance drops. The 1920X failed in this test for an unknown reason.
Agisoft Photoscan 1.0: link
Photoscan stays in our benchmark suite from the previous version, however now we are running on Windows 10 so features such as Speed Shift on the latest processors come into play. The concept of Photoscan is translating many 2D images into a 3D model - so the more detailed the images, and the more you have, the better the model. The algorithm has four stages, some single threaded and some multi-threaded, along with some cache/memory dependency in there as well. For some of the more variable threaded workload, features such as Speed Shift and XFR will be able to take advantage of CPU stalls or downtime, giving sizeable speedups on newer microarchitectures.
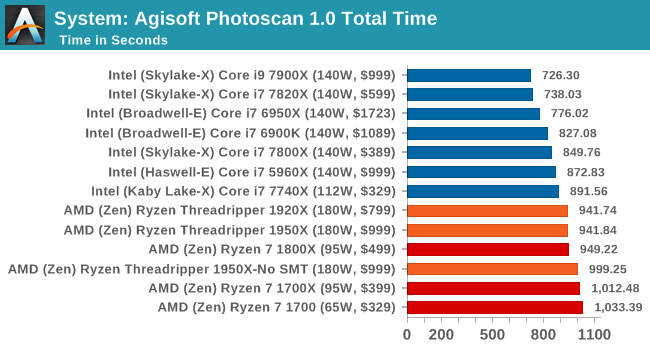
The variable threaded nature of Agisoft shows that in our workflow, it's a mix of cores, IPC and frequency required to win. AMD takes a back seat here, likely due to its AVX implementation.


347 Comments
View All Comments
launchcodemexico - Thursday, August 10, 2017 - link
Why did you end all the gaming review sections with something like "Switching it to Game mode would have made better numbers..."? Why didn't you run the benchmarks in Gaming mode in the first place?Ian Cutress - Thursday, August 10, 2017 - link
Gaming mode is not default, and we run gaming mode alongside the default - there's two sets of values in each graming test.DanNeely - Thursday, August 10, 2017 - link
You might want to call that out more clearly in the text. I also missed that you have two sets of 1950X results; and probably wouldn't've figured out what the -G suffix meant without a hint.Ian Cutress - Thursday, August 10, 2017 - link
I mentioned it in the Game vs Creator mode page, but I'll propagate it through.lordken - Thursday, August 10, 2017 - link
read before you complain, it is stated at beginning of the review that -G is for game mode...DanNeely - Thursday, August 10, 2017 - link
Especially during the work day a lot of people just are doing quick glances at the most interesting parts. I'll end to end read it sometime tonight.mapesdhs - Thursday, August 10, 2017 - link
If people quick-glance, that's their problem for missing key info. :D When learning about something as new as this, I read everything. Otherwise, it's like the tech equivalent of crossing a road while gawping at a phone. :}Last time I read so much about a new CPU launch was Nehalem/X58.
Ian.
smilingcrow - Thursday, August 10, 2017 - link
It seemed really clear to me but for people who didn't read the long text on NUMA etc maybe not.The dangers of skimming!
mapesdhs - Friday, August 11, 2017 - link
Indeed. :D Reminds me of when a long time ebay seller told me that long item decriptions are pointless, because most bidders only read the first paragraph, often only the first sentence.Ian Cutress - Thursday, August 10, 2017 - link
The test suite is a global glove: rather than have 20 tests for each segment, it's a global band of 80 tests for every situation. Johan does different tests as his office is several hundred miles away from where I am (and we're thousands of miles away from any other reviewer).For the gaming benchmarks, there are big differences in 99th percentile frame rates and Time Under analysis. As games become more and more GPU bottlenecked for average frame rates, this is where the differentiation point is. It's a reason why we still test 1080p as well. With regards the AI test, I've asked the Civ team repeatedly to make the AI test accessible from the command line so I can rope it into my testing scripts easily (they already do it with the main GPU test). But like many other game studios, getting them to unlock a flag is a frustrating endeavor when they don't even respond to messages.