The AMD Ryzen 3 1300X and Ryzen 3 1200 CPU Review: Zen on a Budget
by Ian Cutress on July 27, 2017 9:30 AM EST- Posted in
- CPUs
- AMD
- Zen
- Ryzen
- Ryzen 3
- Ryzen 3 1300X
- Ryzen 3 1200
Benchmarking Performance: CPU System Tests
Our first set of tests is our general system tests. These set of tests are meant to emulate more about what people usually do on a system, like opening large files or processing small stacks of data. This is a bit different to our office testing, which uses more industry standard benchmarks, and a few of the benchmarks here are relatively new and different.
All of our benchmark results can also be found in our benchmark engine, Bench.
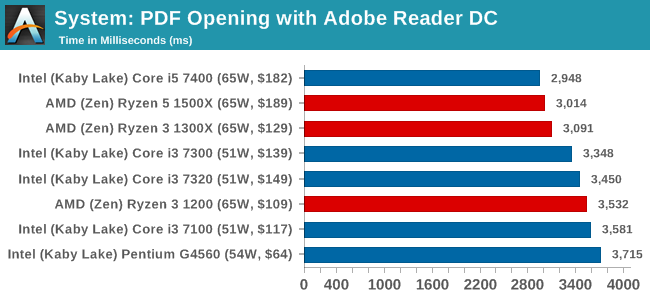
PDF Opening
First up is a self-penned test using a monstrous PDF we once received in advance of attending an event. While the PDF was only a single page, it had so many high-quality layers embedded it was taking north of 15 seconds to open and to gain control on the mid-range notebook I was using at the time. This put it as a great candidate for our 'let's open an obnoxious PDF' test. Here we use Adobe Reader DC, and disable all the update functionality within. The benchmark sets the screen to 1080p, opens the PDF to in fit-to-screen mode, and measures the time from sending the command to open the PDF until it is fully displayed and the user can take control of the software again. The test is repeated ten times, and the average time taken. Results are in milliseconds.
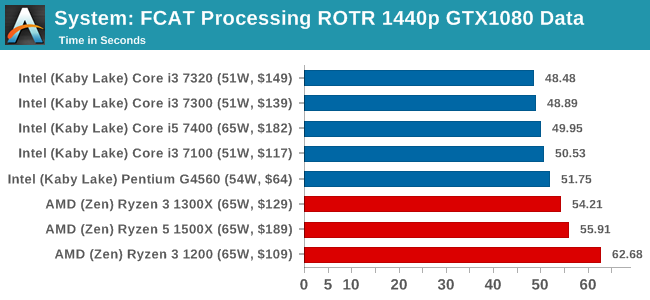
FCAT Processing: link
One of the more interesting workloads that has crossed our desks in recent quarters is FCAT - the tool we use to measure stuttering in gaming due to dropped or runt frames. The FCAT process requires enabling a color-based overlay onto a game, recording the gameplay, and then parsing the video file through the analysis software. The software is mostly single-threaded, however because the video is basically in a raw format, the file size is large and requires moving a lot of data around. For our test, we take a 90-second clip of the Rise of the Tomb Raider benchmark running on a GTX 980 Ti at 1440p, which comes in around 21 GB, and measure the time it takes to process through the visual analysis tool.
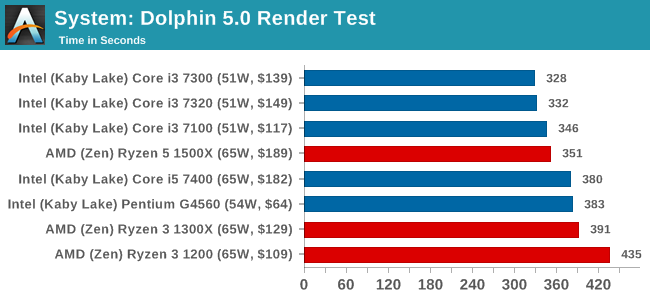
Dolphin Benchmark: link
Many emulators are often bound by single thread CPU performance, and general reports tended to suggest that Haswell provided a significant boost to emulator performance. This benchmark runs a Wii program that ray traces a complex 3D scene inside the Dolphin Wii emulator. Performance on this benchmark is a good proxy of the speed of Dolphin CPU emulation, which is an intensive single core task using most aspects of a CPU. Results are given in minutes, where the Wii itself scores 17.53 minutes.
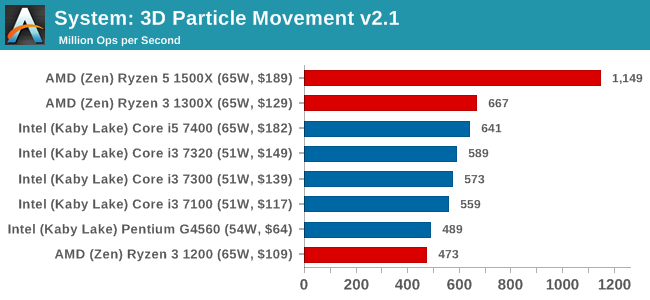
3D Movement Algorithm Test v2.1: link
This is the latest version of the self-penned 3DPM benchmark. The goal of 3DPM is to simulate semi-optimized scientific algorithms taken directly from my doctorate thesis. Version 2.1 improves over 2.0 by passing the main particle structs by reference rather than by value, and decreasing the amount of double->float->double recasts the compiler was adding in. It affords a ~25% speed-up over v2.0, which means new data.
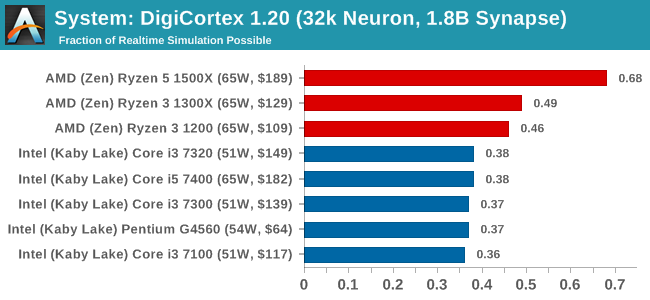
DigiCortex v1.20: link
Despite being a couple of years old, the DigiCortex software is a pet project for the visualization of neuron and synapse activity in the brain. The software comes with a variety of benchmark modes, and we take the small benchmark which runs a 32k neuron/1.8B synapse simulation. The results on the output are given as a fraction of whether the system can simulate in real-time, so anything above a value of one is suitable for real-time work. The benchmark offers a 'no firing synapse' mode, which in essence detects DRAM and bus speed, however we take the firing mode which adds CPU work with every firing.
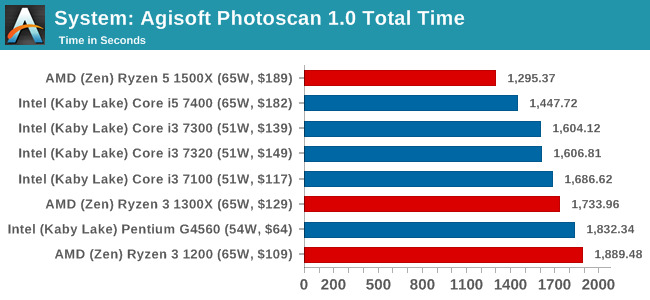
Agisoft Photoscan 1.0: link
Photoscan stays in our benchmark suite from the previous version, however now we are running on Windows 10 so features such as Speed Shift on the latest processors come into play. The concept of Photoscan is translating many 2D images into a 3D model - so the more detailed the images, and the more you have, the better the model. The algorithm has four stages, some single threaded and some multi-threaded, along with some cache/memory dependency in there as well. For some of the more variable threaded workload, features such as Speed Shift and XFR will be able to take advantage of CPU stalls or downtime, giving sizeable speedups on newer microarchitectures.


140 Comments
View All Comments
Ian Cutress - Thursday, July 27, 2017 - link
AMD doesn't use the R3 / R5 / R7 nomenclature - that's for graphics.Gothmoth - Thursday, July 27, 2017 - link
i don´t care about gaming or heating my house with a cpu..... so ryzen makes more sense for me. :)x299 was such a disappointment.
MrCommunistGen - Thursday, July 27, 2017 - link
Ian, first off, thanks for the benchmark numbers! I look forward to seeing the rest once they are completed.As far as data is concerned, is there a chance that the DigiCortex results have the wrong numbers next to a couple CPUs?
I'm specifically looking at the i3 7100 being the fastest Intel CPU at 0.63, compared to the rest of the offerings clustering together at 0.37-0.38. To me it looks like the 0.63 should be the i5 7400 and the 7100 should be with the other dual cores.
On another note, it looks like the RoTR Geothermal Valley scene really HATES AMD's HyperThreading - at least on Nvidia hardware/drivers. At first I thought there might be another set of numbers transposed somewhere since the Ryzen 3 CPUs perform SO MUCH better than the 1500X. But I looked back at the 1600X review and the numbers seem consistent -- bad performance on HyperThreaded AMD on a GTX 1080. Prophet's Tomb seems to behave better. Just shows how much architecture and software optimizations for said architecture can either oppose or compliment each other.
As for small typos, there's also a couple spots where the 1200 is referred to as "1200X". There was another one I found during my initial read that I can't find now that I'm commenting.
MrCommunistGen - Thursday, July 27, 2017 - link
Not the typo I was looking for, but I just noticed that the intro/description for Civ6 looks like it has a typo I've missed in previous articles:"...but every edition from the second to the sixth, including the fifth as voiced by the late Leonard Nimoy, it a game that is easy to pick up, but hard to master."
"it a game" should probably be "is a game"
Not a criticism, just trying to help out where I can. :)
MrCommunistGen - Thursday, July 27, 2017 - link
Gah... brain fart this morning. Please read my references to AMD "HyperThreading" as "SMT"... smhIan Cutress - Thursday, July 27, 2017 - link
i3 7100 should be 0.363x on DigiCortex. I've corrected three 7100 results today in our database from my personal master copy. I think I'll have to go through them all and double check.RoTR Geothermal on 1080p with a GTX 1080 really loves quad cores without hyperthreading, AMD or Intel. I'm not sure what it is with that test on that benchmark - in our KBL-X review, all the i5s got top results by a good margin. I think it's been optimized specifically for quad-core, or there's something iffy in the game code/drivers.
Appreciate the typo point outs for sure. These things are always last minute and you can never have too many eyes on it. :)
DanGer1 - Thursday, July 27, 2017 - link
The review is lacking, especially the value charts. Ryzens come with a cooler, their motherboards cost less and they are overclock-able. Adjusting the cost for the motherboard and the cooler changes the value charts significantly in R3's favor. Overclocking on stock air makes makes performance and value a no contest in favor of the R3s.MajGenRelativity - Thursday, July 27, 2017 - link
Intel's processors also come with a cooler.wallysb01 - Thursday, July 27, 2017 - link
Basic 1511 boards that would go into i3/Pentium builds are really not much more, if at all, than the lower end AM4 boards. Plus, the Intel stuff has an iGPU and if you're buying a low end desktop, you probably don't care a lot about heavily multithreaded workloads. So, I'd actually argue the i3/Pentiums are getting under sold in the value charts.Its kinda funny how the landscape has switched, in that Intel might actually be the better low-end, value winner, while AMD is the best mid/mid-high end value winner.
Gothmoth - Thursday, July 27, 2017 - link
+1 for overclocking.the tested intel cpus are sure not k models.
as for intel having internal GPU.. i never used them not even on my cheapest system builds.