The AMD Ryzen 3 1300X and Ryzen 3 1200 CPU Review: Zen on a Budget
by Ian Cutress on July 27, 2017 9:30 AM EST- Posted in
- CPUs
- AMD
- Zen
- Ryzen
- Ryzen 3
- Ryzen 3 1300X
- Ryzen 3 1200
Rise of the Tomb Raider
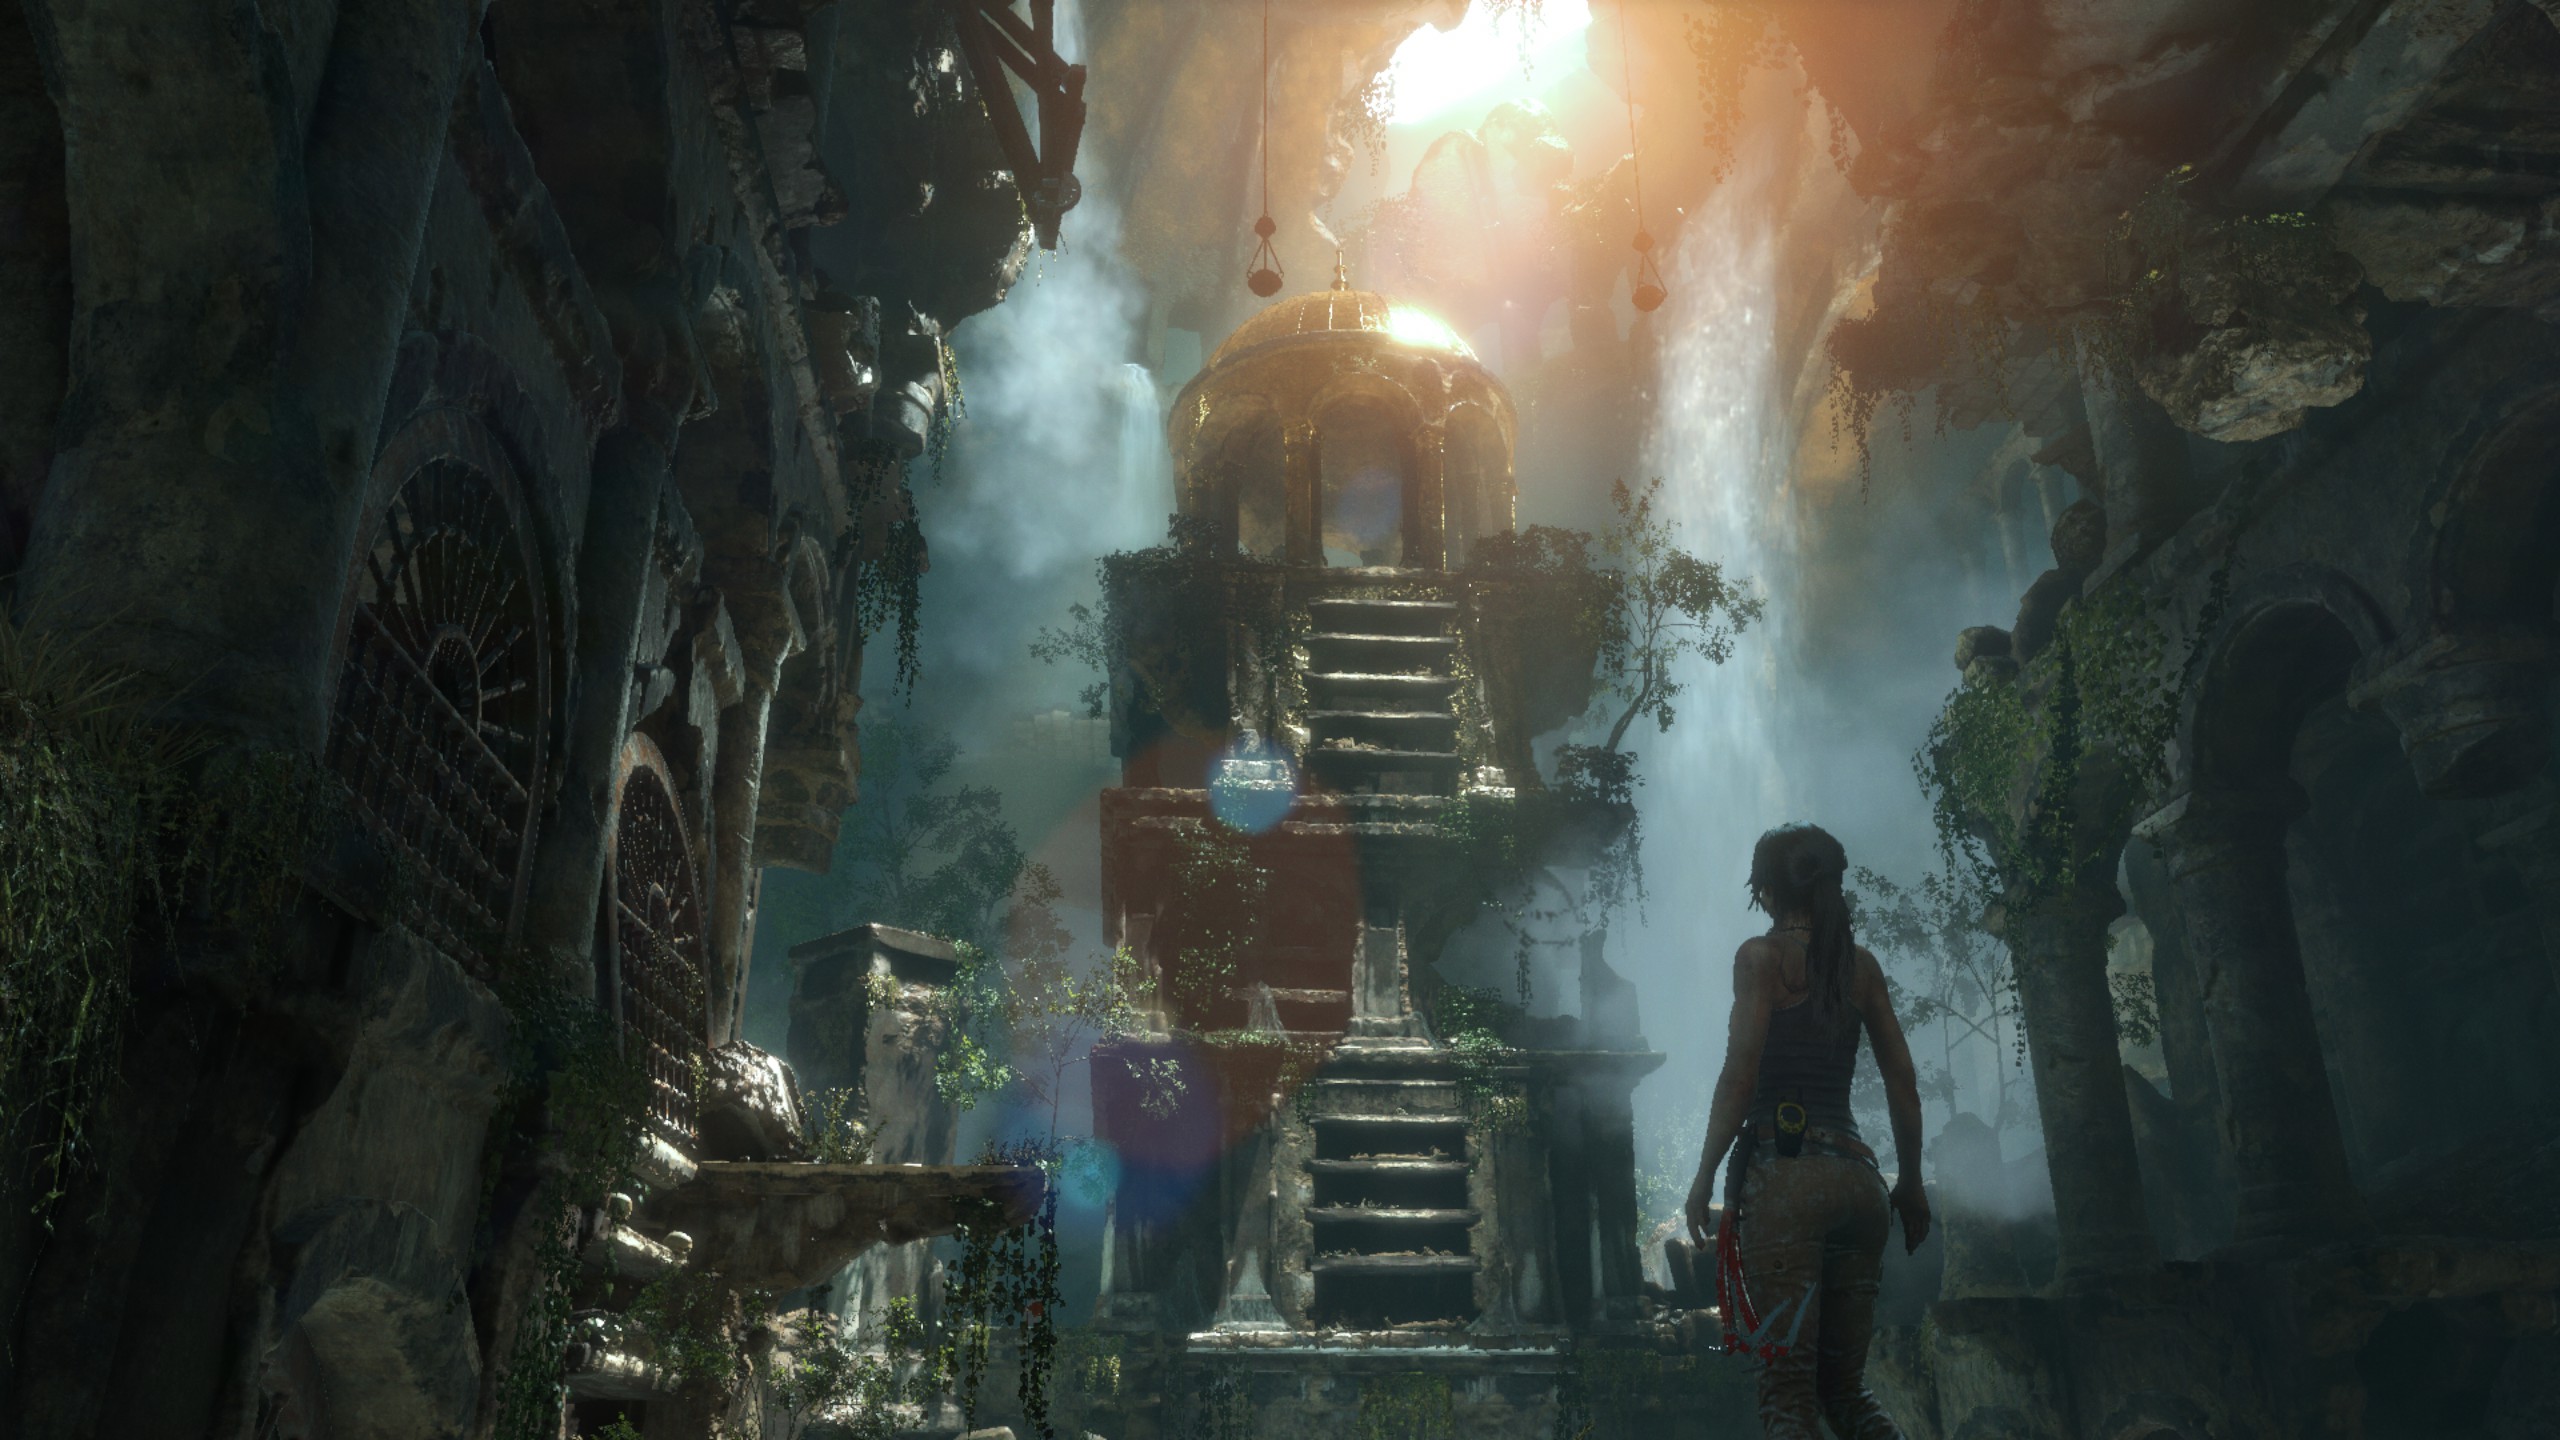
One of the newest games in the gaming benchmark suite is Rise of the Tomb Raider (RoTR), developed by Crystal Dynamics, and the sequel to the popular Tomb Raider which was loved for its automated benchmark mode. But don’t let that fool you: the benchmark mode in RoTR is very much different this time around.
Visually, the previous Tomb Raider pushed realism to the limits with features such as TressFX, and the new RoTR goes one stage further when it comes to graphics fidelity. This leads to an interesting set of requirements in hardware: some sections of the game are typically GPU limited, whereas others with a lot of long-range physics can be CPU limited, depending on how the driver can translate the DirectX 12 workload.
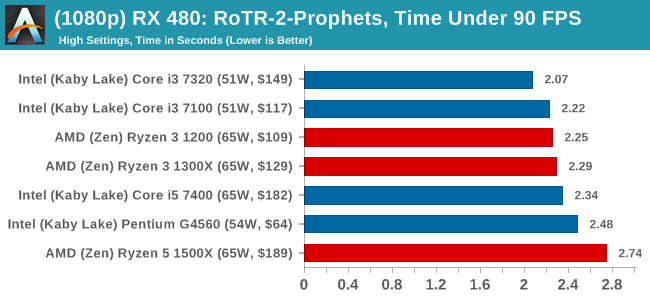
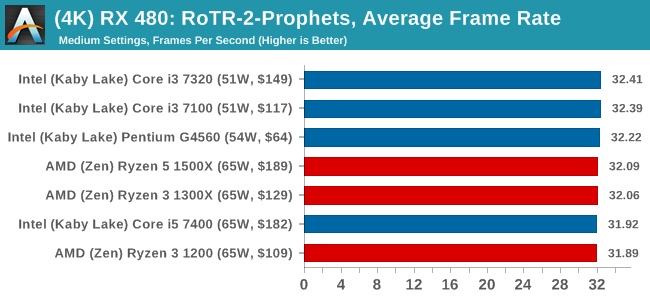
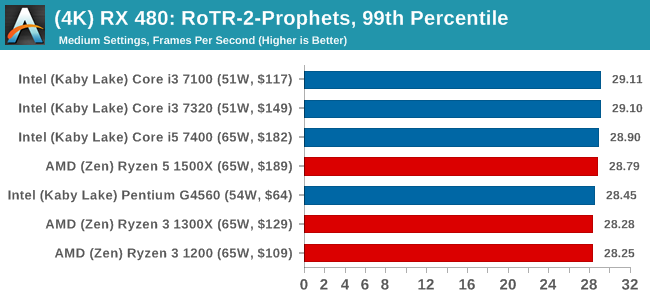
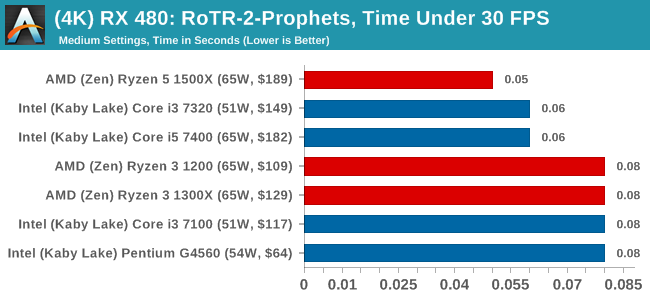
Where the old game had one benchmark scene, the new game has three different scenes with different requirements: Geothermal Valley (1-Valley), Prophet’s Tomb (2-Prophet) and Spine of the Mountain (3-Mountain) - and we test all three. These are three scenes designed to be taken from the game, but it has been noted that scenes like 2-Prophet shown in the benchmark can be the most CPU limited elements of that entire level, and the scene shown is only a small portion of that level. Because of this, we report the results for each scene on each graphics card separately.

Graphics options for RoTR are similar to other games in this type, offering some presets or allowing the user to configure texture quality, anisotropic filter levels, shadow quality, soft shadows, occlusion, depth of field, tessellation, reflections, foliage, bloom, and features like PureHair which updates on TressFX in the previous game.
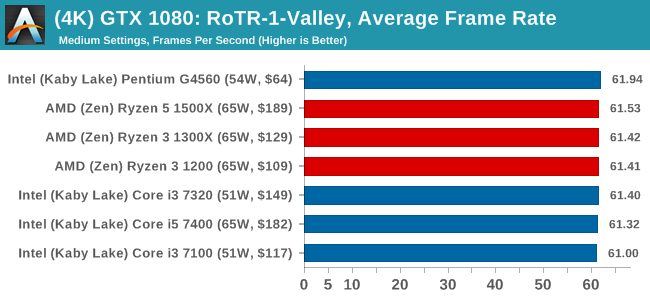
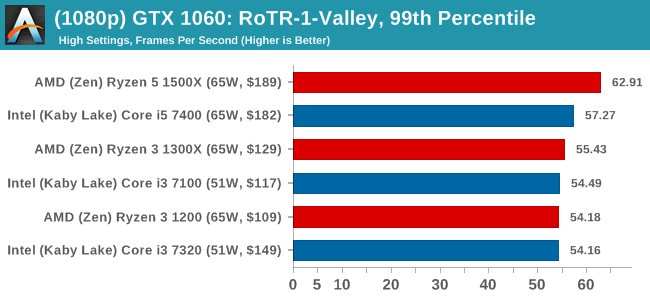
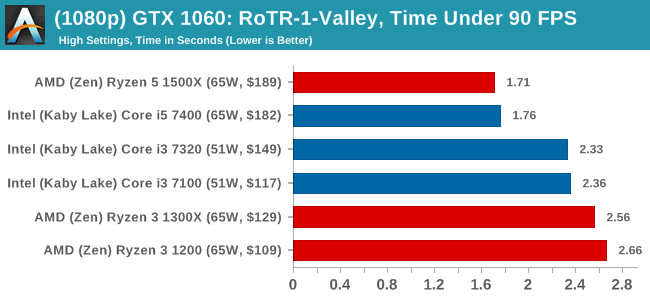
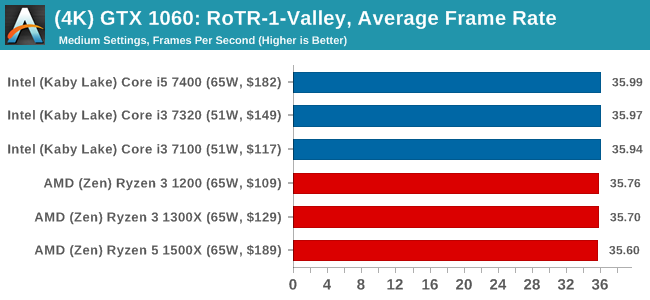
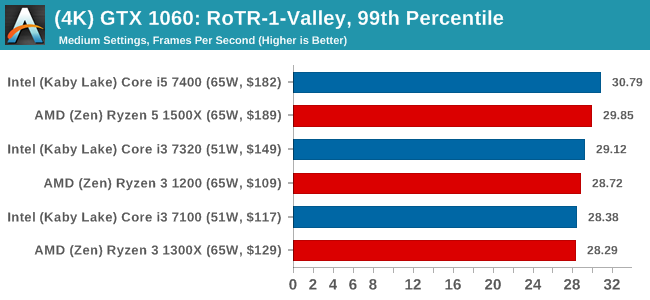
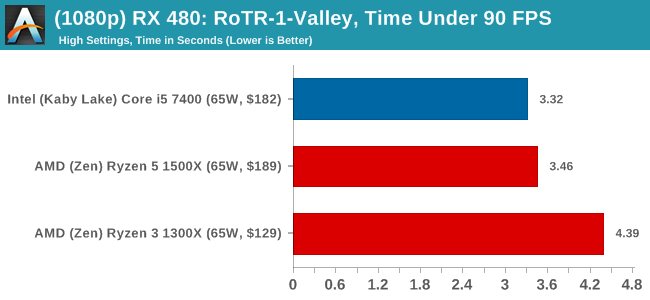
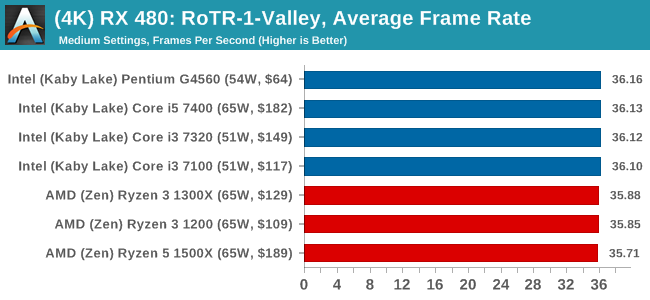
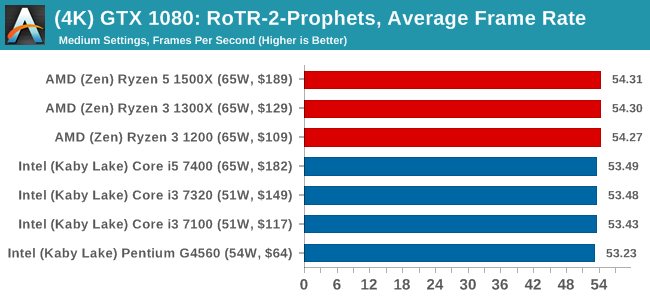
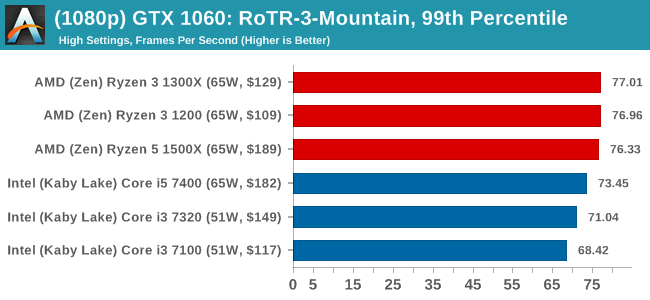
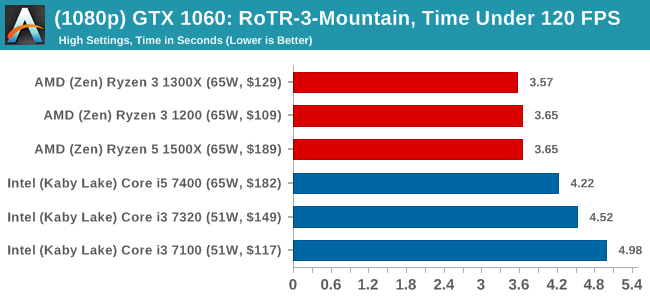
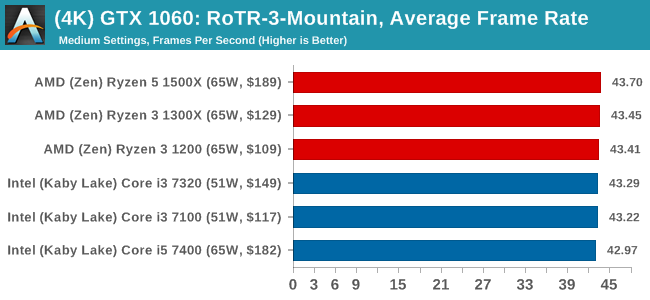
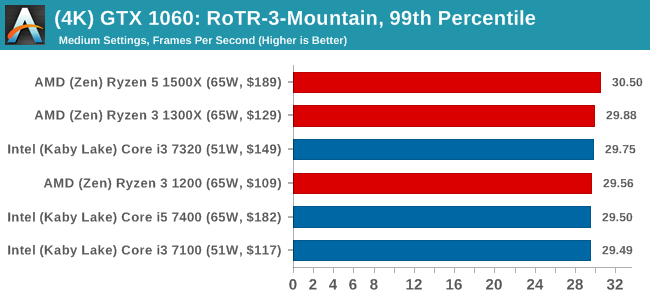
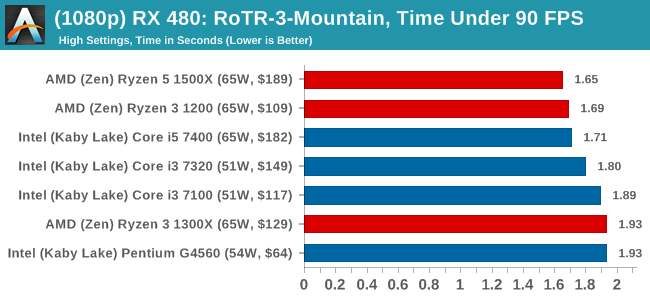
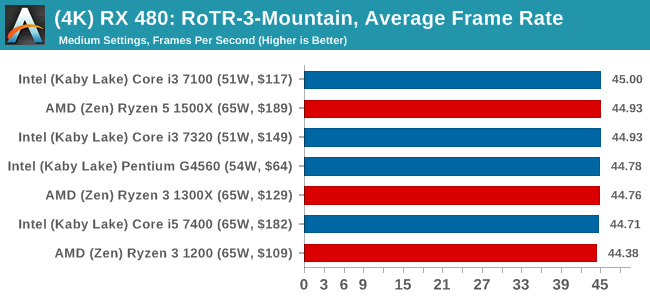
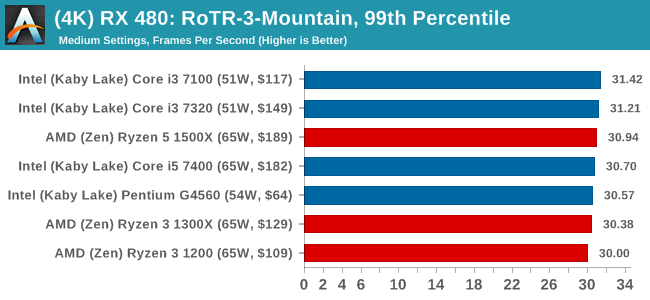
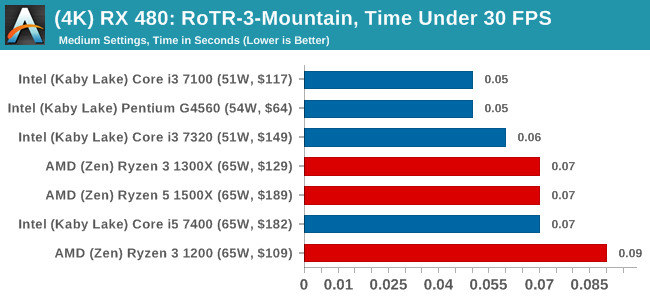
Again, we test at 1920x1080 and 4K using our native 4K displays. At 1080p we run the High preset, while at 4K we use the Medium preset which still takes a sizable hit in frame rate.
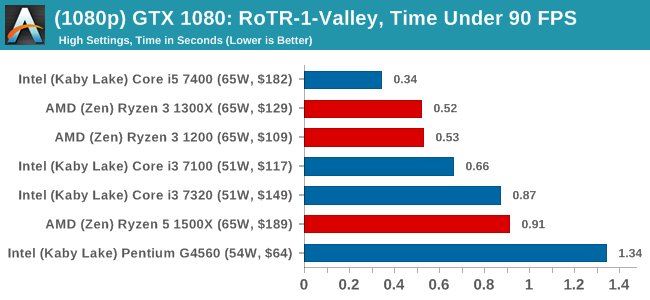
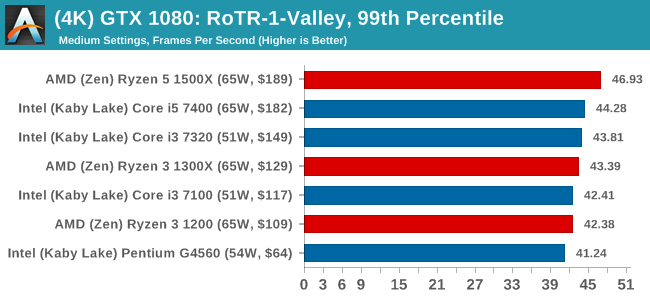
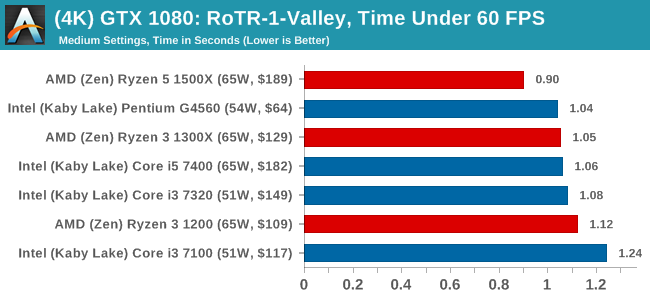
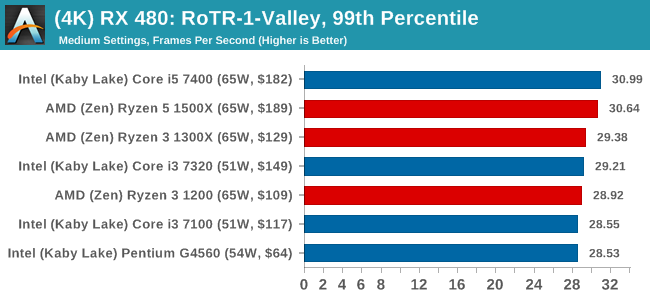
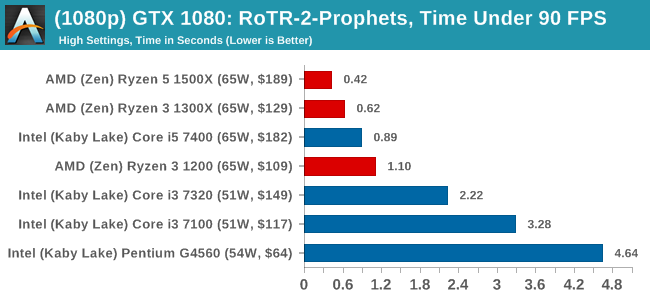
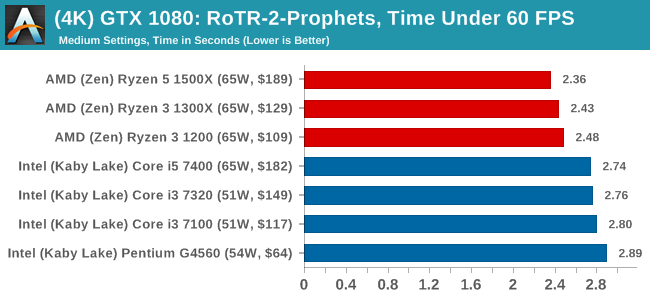
It is worth noting that RoTR is a little different to our other benchmarks in that it keeps its graphics settings in the registry rather than a standard ini file, and unlike the previous TR game the benchmark cannot be called from the command-line. Nonetheless we scripted around these issues to automate the benchmark four times and parse the results. From the frame time data, we report the averages, 99th percentiles, and our time under analysis.
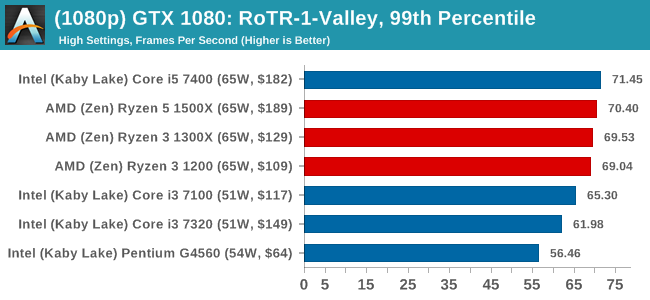
For all our results, we show the average frame rate at 1080p first. Mouse over the other graphs underneath to see 99th percentile frame rates and 'Time Under' graphs, as well as results for other resolutions. All of our benchmark results can also be found in our benchmark engine, Bench.
#1 Geothermal Valley

MSI GTX 1080 Gaming 8G Performance
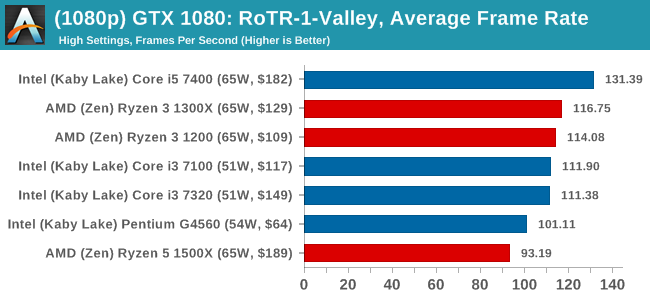
1080p
4K
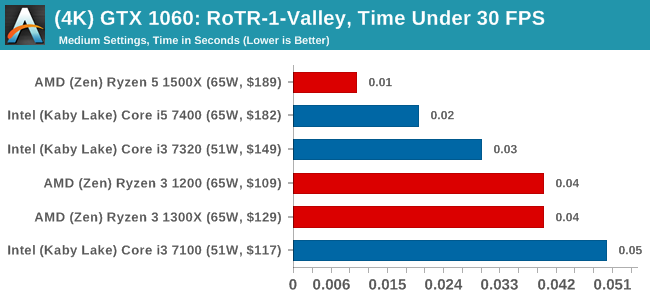
ASUS GTX 1060 Strix 6GB Performance
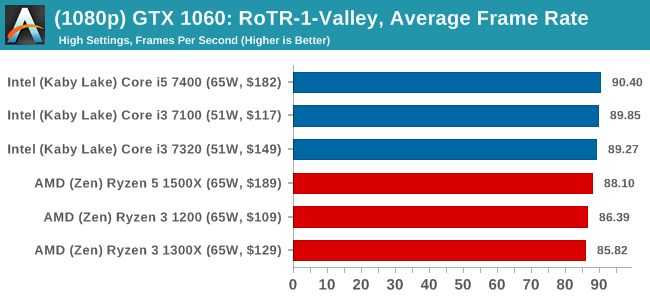
1080p
4K
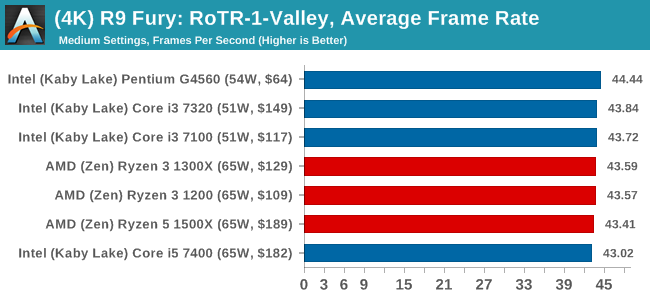
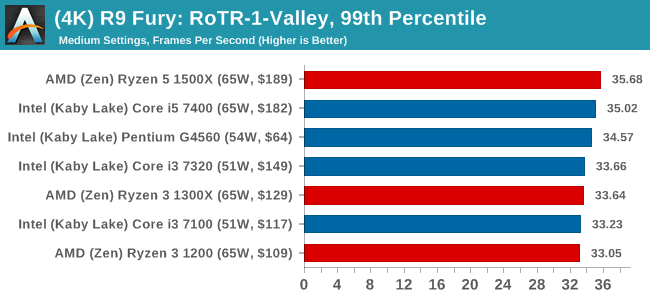
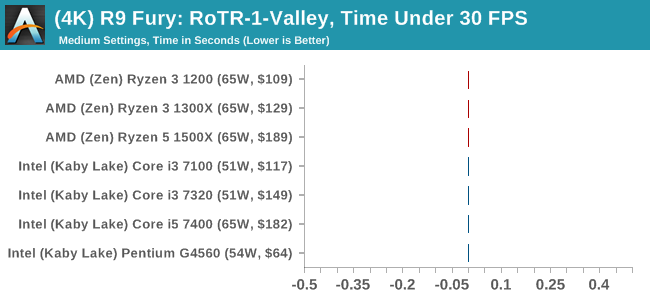
Sapphire R9 Fury 4GB Performance
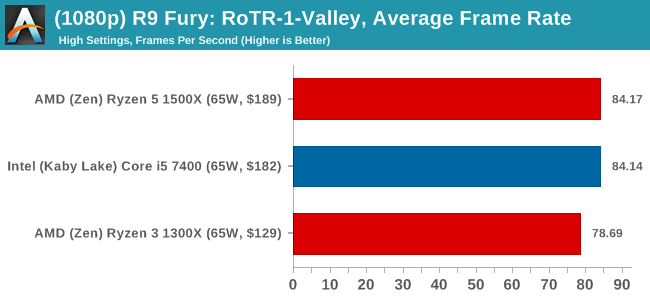
1080p

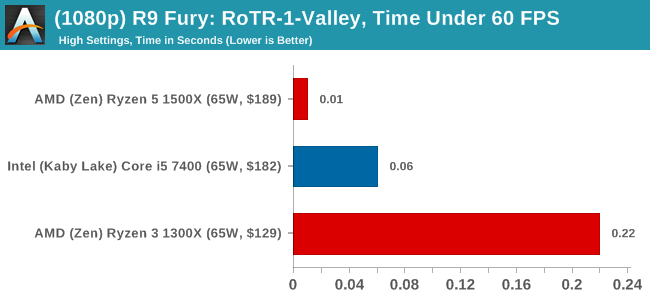
4K
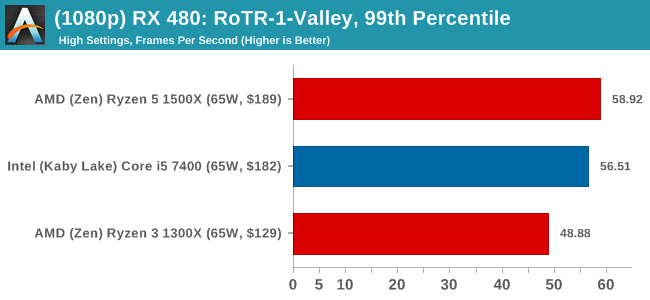
Sapphire RX 480 8GB Performance
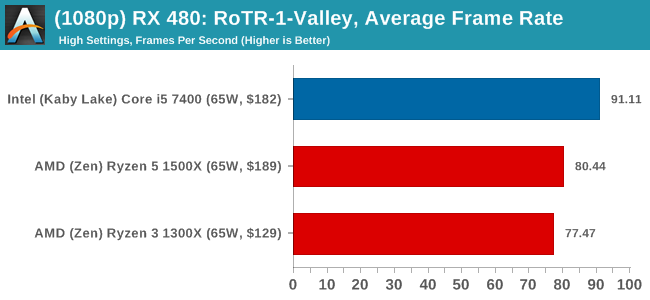
1080p
4K

Geothermal Valley had some issues in our benchmark test suite, where the 1080p benchmark wouldn't output frame time data for the first section. The issue has been debugged from our end and future reviews should contain all the data.
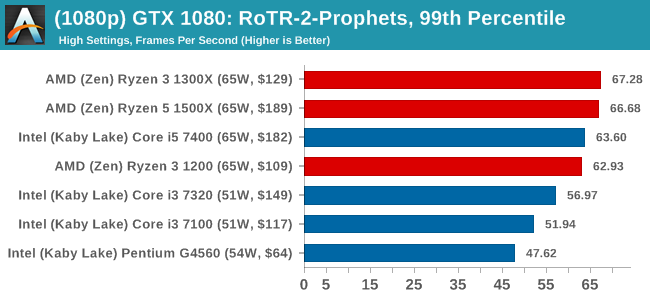
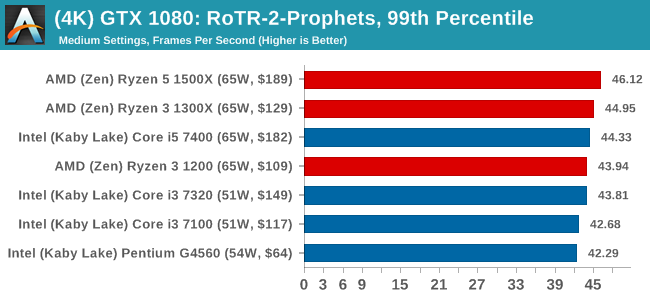
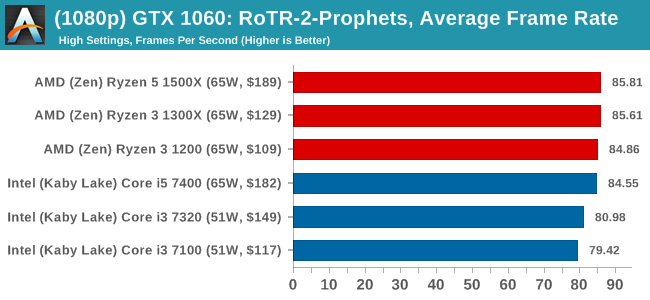
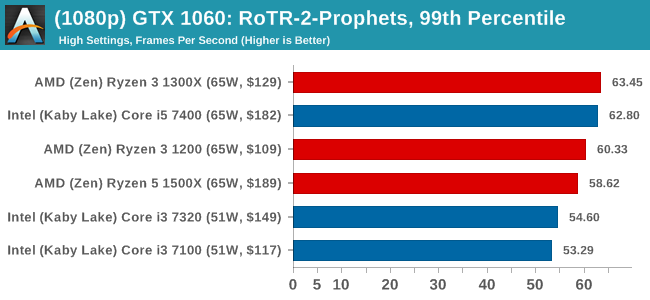
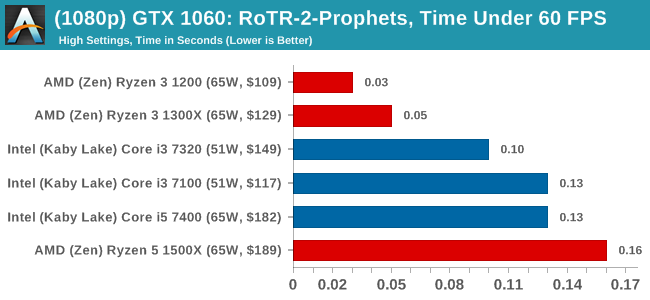
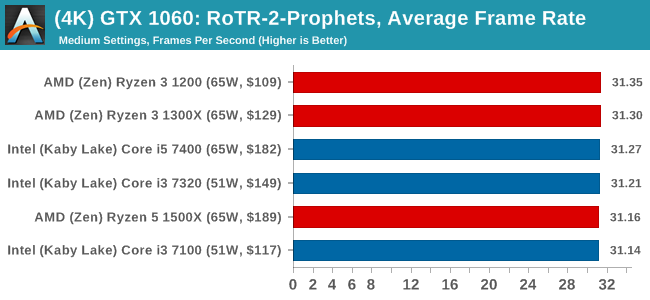
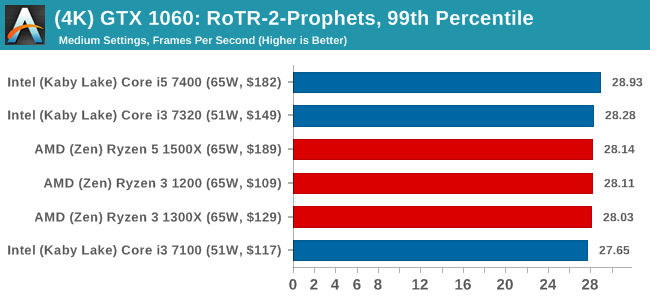
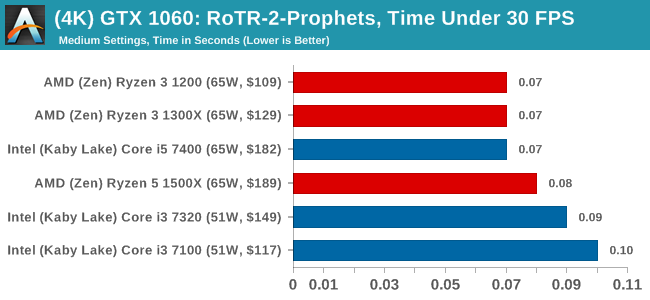
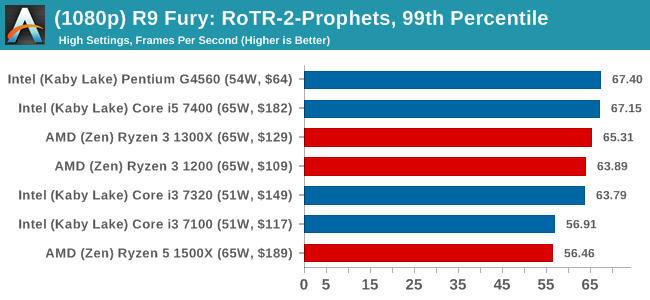
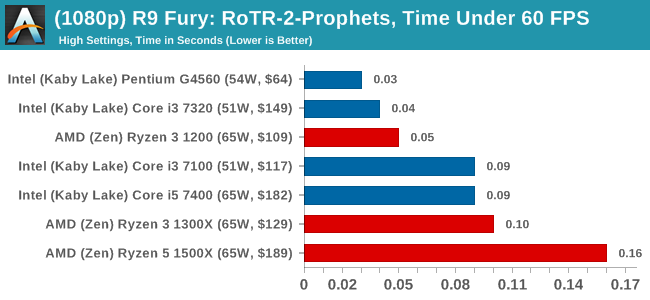
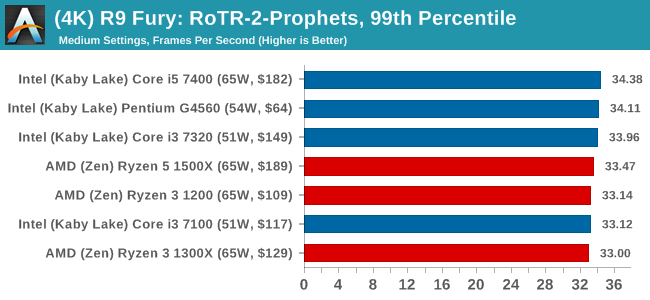
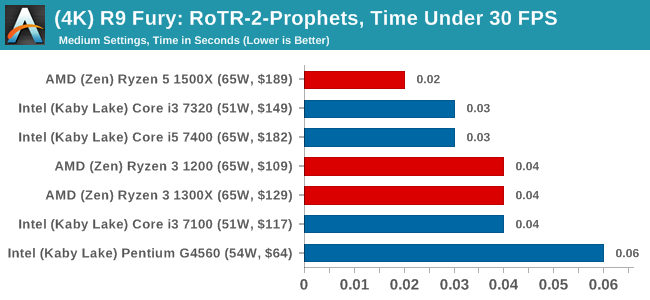
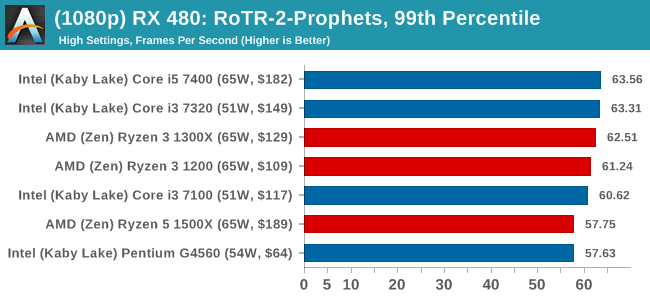
#2 Prophet's Tomb
MSI GTX 1080 Gaming 8G Performance
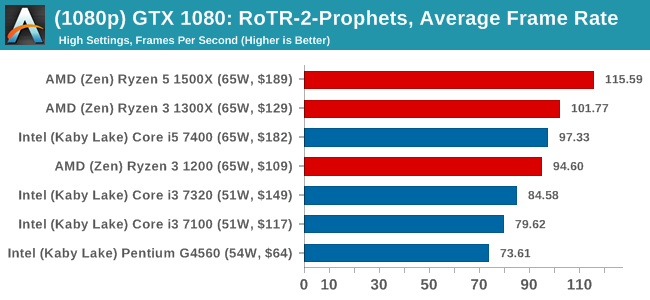
1080p
4K
ASUS GTX 1060 Strix 6GB Performance
1080p
4K
Sapphire R9 Fury 4GB Performance
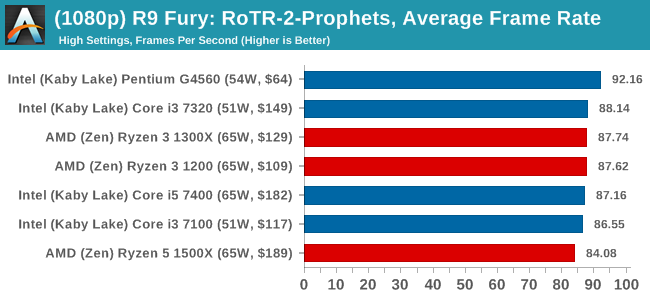
1080p
4K
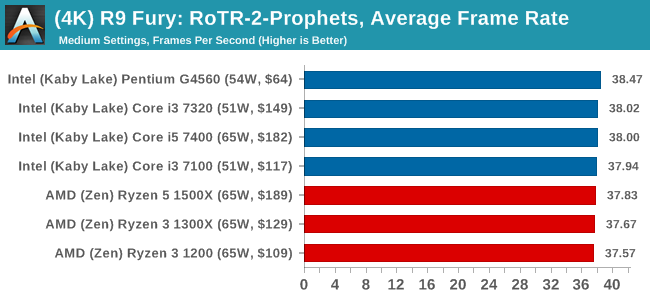
Sapphire RX 480 8GB Performance
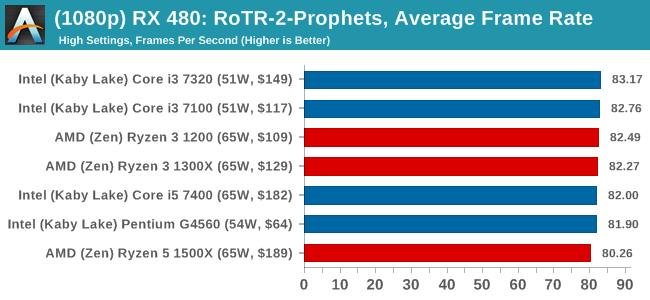
1080p
4K
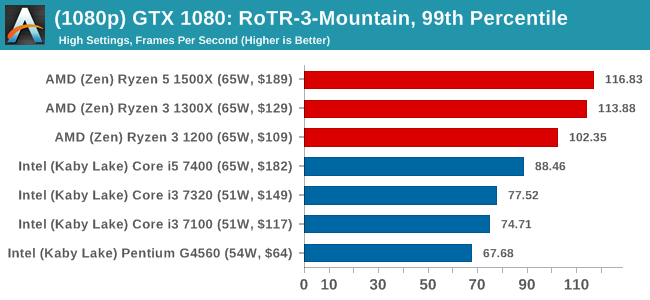
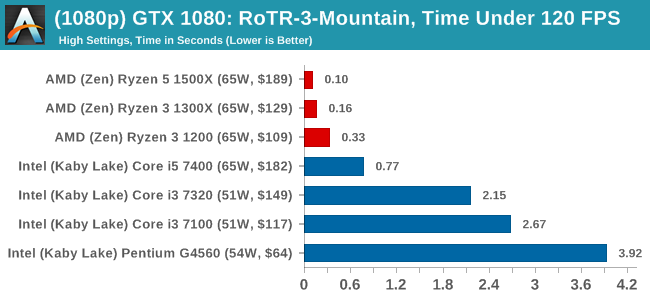
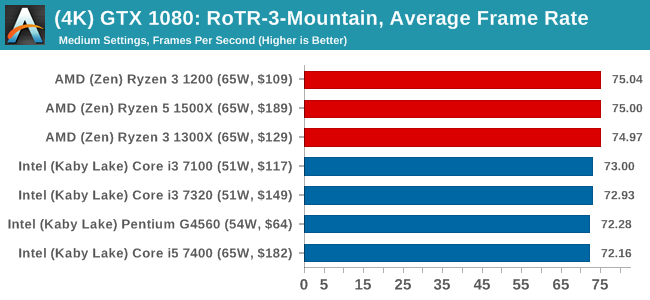
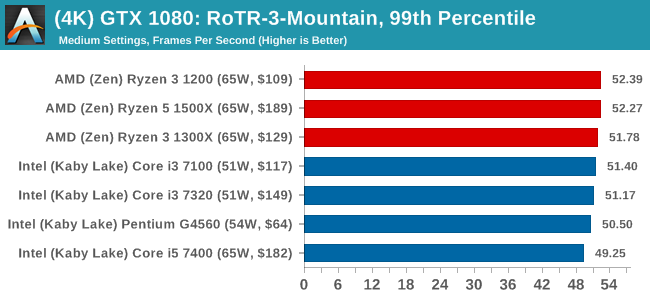
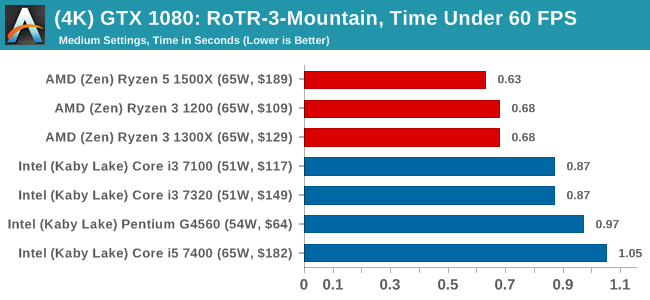
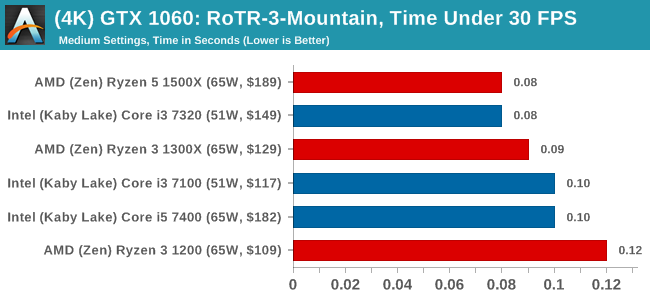
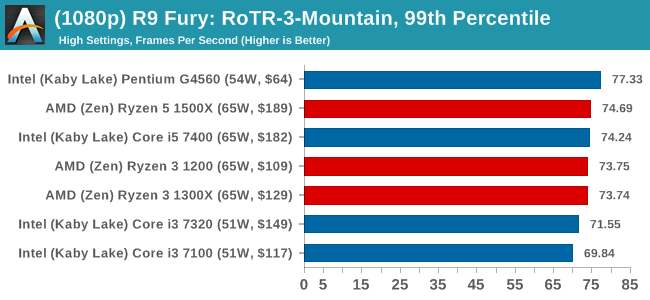
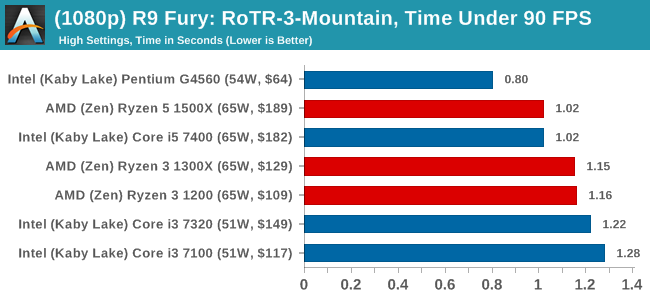
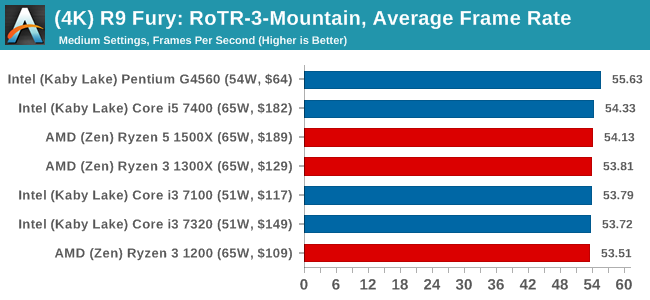
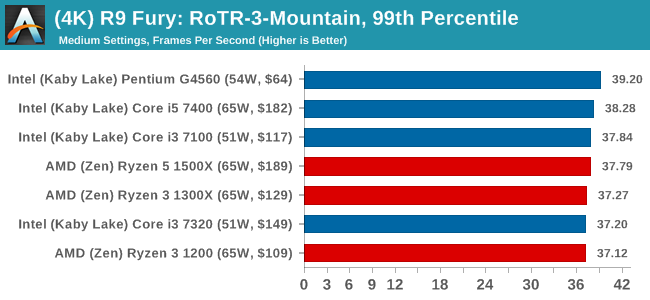
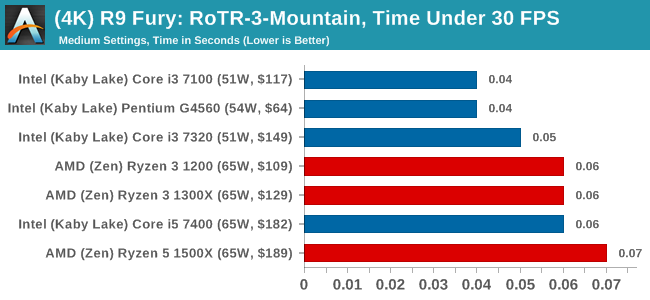
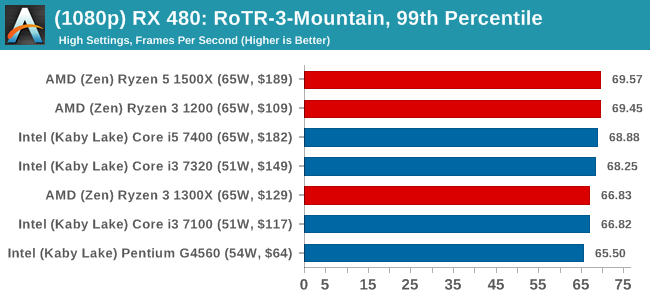
#3 Spine of the Mountain
MSI GTX 1080 Gaming 8G Performance
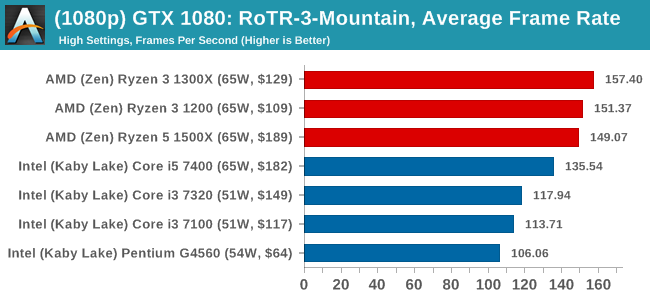
1080p
4K
ASUS GTX 1060 Strix 6GB Performance
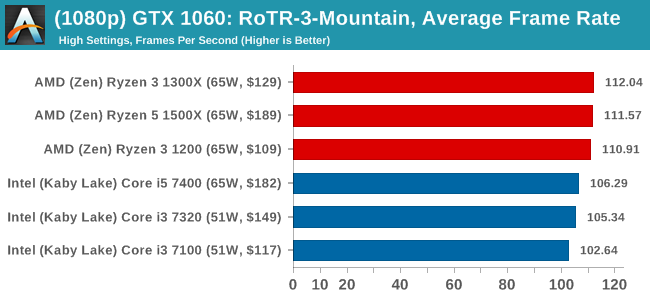
1080p
4K
Sapphire R9 Fury 4GB Performance
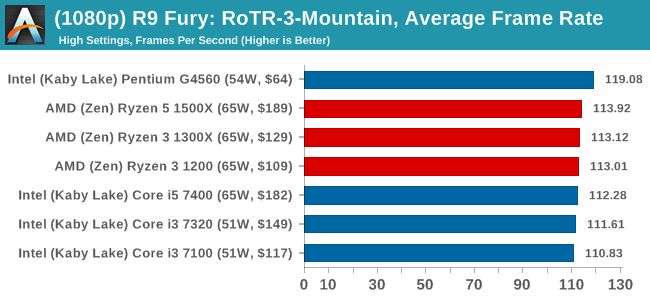
1080p
4K
Sapphire RX 480 8GB Performance

1080p
4K


140 Comments
View All Comments
Ian Cutress - Thursday, July 27, 2017 - link
AMD doesn't use the R3 / R5 / R7 nomenclature - that's for graphics.Gothmoth - Thursday, July 27, 2017 - link
i don´t care about gaming or heating my house with a cpu..... so ryzen makes more sense for me. :)x299 was such a disappointment.
MrCommunistGen - Thursday, July 27, 2017 - link
Ian, first off, thanks for the benchmark numbers! I look forward to seeing the rest once they are completed.As far as data is concerned, is there a chance that the DigiCortex results have the wrong numbers next to a couple CPUs?
I'm specifically looking at the i3 7100 being the fastest Intel CPU at 0.63, compared to the rest of the offerings clustering together at 0.37-0.38. To me it looks like the 0.63 should be the i5 7400 and the 7100 should be with the other dual cores.
On another note, it looks like the RoTR Geothermal Valley scene really HATES AMD's HyperThreading - at least on Nvidia hardware/drivers. At first I thought there might be another set of numbers transposed somewhere since the Ryzen 3 CPUs perform SO MUCH better than the 1500X. But I looked back at the 1600X review and the numbers seem consistent -- bad performance on HyperThreaded AMD on a GTX 1080. Prophet's Tomb seems to behave better. Just shows how much architecture and software optimizations for said architecture can either oppose or compliment each other.
As for small typos, there's also a couple spots where the 1200 is referred to as "1200X". There was another one I found during my initial read that I can't find now that I'm commenting.
MrCommunistGen - Thursday, July 27, 2017 - link
Not the typo I was looking for, but I just noticed that the intro/description for Civ6 looks like it has a typo I've missed in previous articles:"...but every edition from the second to the sixth, including the fifth as voiced by the late Leonard Nimoy, it a game that is easy to pick up, but hard to master."
"it a game" should probably be "is a game"
Not a criticism, just trying to help out where I can. :)
MrCommunistGen - Thursday, July 27, 2017 - link
Gah... brain fart this morning. Please read my references to AMD "HyperThreading" as "SMT"... smhIan Cutress - Thursday, July 27, 2017 - link
i3 7100 should be 0.363x on DigiCortex. I've corrected three 7100 results today in our database from my personal master copy. I think I'll have to go through them all and double check.RoTR Geothermal on 1080p with a GTX 1080 really loves quad cores without hyperthreading, AMD or Intel. I'm not sure what it is with that test on that benchmark - in our KBL-X review, all the i5s got top results by a good margin. I think it's been optimized specifically for quad-core, or there's something iffy in the game code/drivers.
Appreciate the typo point outs for sure. These things are always last minute and you can never have too many eyes on it. :)
DanGer1 - Thursday, July 27, 2017 - link
The review is lacking, especially the value charts. Ryzens come with a cooler, their motherboards cost less and they are overclock-able. Adjusting the cost for the motherboard and the cooler changes the value charts significantly in R3's favor. Overclocking on stock air makes makes performance and value a no contest in favor of the R3s.MajGenRelativity - Thursday, July 27, 2017 - link
Intel's processors also come with a cooler.wallysb01 - Thursday, July 27, 2017 - link
Basic 1511 boards that would go into i3/Pentium builds are really not much more, if at all, than the lower end AM4 boards. Plus, the Intel stuff has an iGPU and if you're buying a low end desktop, you probably don't care a lot about heavily multithreaded workloads. So, I'd actually argue the i3/Pentiums are getting under sold in the value charts.Its kinda funny how the landscape has switched, in that Intel might actually be the better low-end, value winner, while AMD is the best mid/mid-high end value winner.
Gothmoth - Thursday, July 27, 2017 - link
+1 for overclocking.the tested intel cpus are sure not k models.
as for intel having internal GPU.. i never used them not even on my cheapest system builds.