The Intel Kaby Lake-X i7 7740X and i5 7640X Review: The New Single-Threaded Champion, OC to 5GHz
by Ian Cutress on July 24, 2017 8:30 AM EST- Posted in
- CPUs
- Intel
- Kaby Lake
- X299
- Basin Falls
- Kaby Lake-X
- i7-7740X
- i5-7640X
Benchmarking Performance: CPU Rendering Tests
Rendering tests are a long-time favorite of reviewers and benchmarkers, as the code used by rendering packages is usually highly optimized to squeeze every little bit of performance out. Sometimes rendering programs end up being heavily memory dependent as well - when you have that many threads flying about with a ton of data, having low latency memory can be key to everything. Here we take a few of the usual rendering packages under Windows 10, as well as a few new interesting benchmarks.
All of our benchmark results can also be found in our benchmark engine, Bench.
Corona 1.3: link
Corona is a standalone package designed to assist software like 3ds Max and Maya with photorealism via ray tracing. It's simple - shoot rays, get pixels. OK, it's more complicated than that, but the benchmark renders a fixed scene six times and offers results in terms of time and rays per second. The official benchmark tables list user submitted results in terms of time, however I feel rays per second is a better metric (in general, scores where higher is better seem to be easier to explain anyway). Corona likes to pile on the threads, so the results end up being very staggered based on thread count.
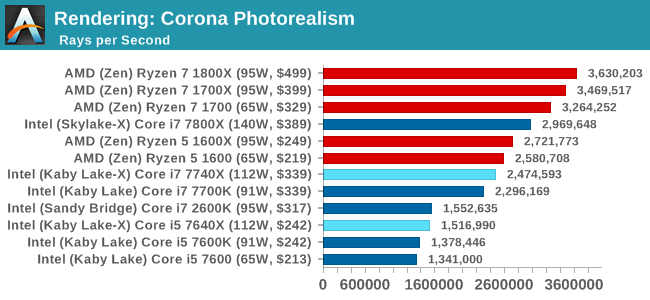
More threads win the day, although the Core i7 does knock at the door of the Ryzen 5 (presumably with $110 in hand as well). It is worth noting that the Core i5-7640X and the older Core i7-2600K are on equal terms.
Blender 2.78: link
For a render that has been around for what seems like ages, Blender is still a highly popular tool. We managed to wrap up a standard workload into the February 5 nightly build of Blender and measure the time it takes to render the first frame of the scene. Being one of the bigger open source tools out there, it means both AMD and Intel work actively to help improve the codebase, for better or for worse on their own/each other's microarchitecture.
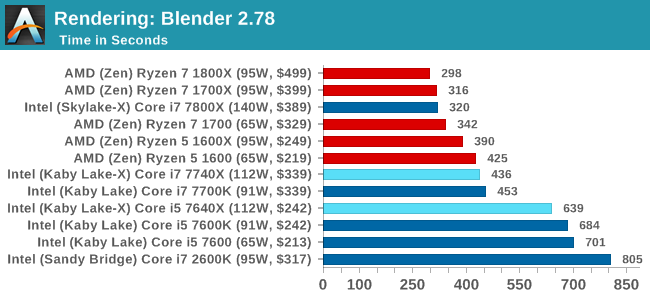
Similar to Corona, more threads means a faster time.
LuxMark v3.1: Link
As a synthetic, LuxMark might come across as somewhat arbitrary as a renderer, given that it's mainly used to test GPUs, but it does offer both an OpenCL and a standard C++ mode. In this instance, aside from seeing the comparison in each coding mode for cores and IPC, we also get to see the difference in performance moving from a C++ based code-stack to an OpenCL one with a CPU as the main host.
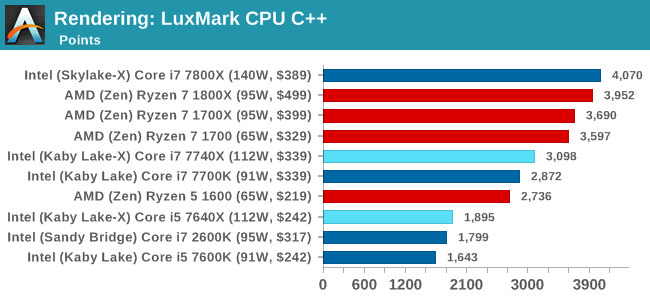
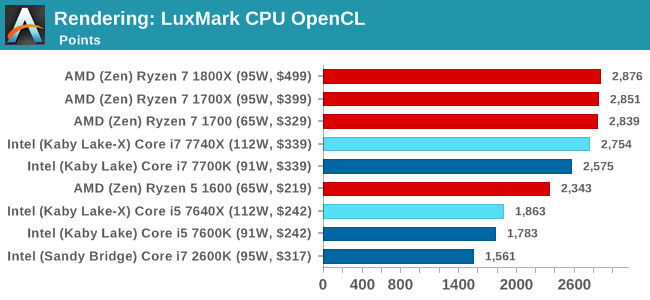
Luxmark is more thread and cache dependent, and so the Core i7 nips at the heels of the AMD parts with double the threads. The Core i5 sits behind the the Ryzen 5 parts though, due to the 1:3 thread difference.
POV-Ray 3.7.1b4: link
Another regular benchmark in most suites, POV-Ray is another ray-tracer but has been around for many years. It just so happens that during the run up to AMD's Ryzen launch, the code base started to get active again with developers making changes to the code and pushing out updates. Our version and benchmarking started just before that was happening, but given time we will see where the POV-Ray code ends up and adjust in due course.
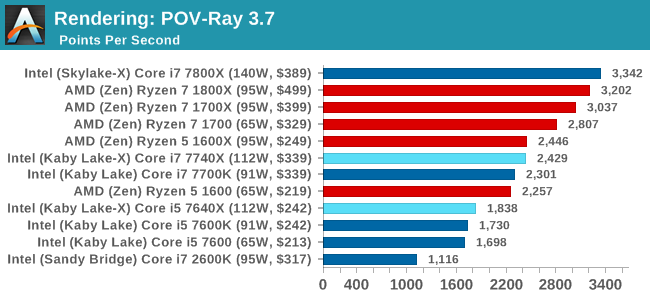
Mirror Mirror on the wall...
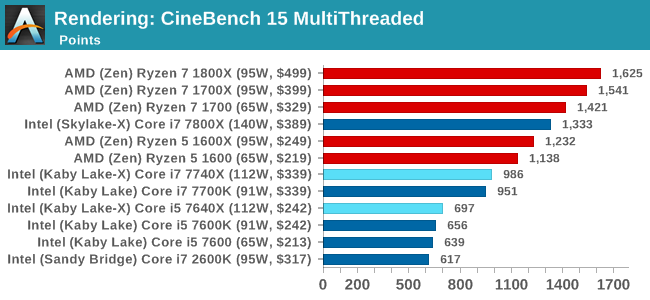
Cinebench R15: link
The latest version of CineBench has also become one of those 'used everywhere' benchmarks, particularly as an indicator of single thread performance. High IPC and high frequency gives performance in ST, whereas having good scaling and many cores is where the MT test wins out.
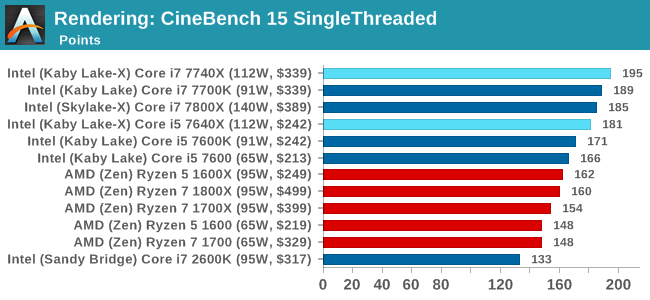
CineBench gives us singlethreaded numbers, and it is clear who rules the roost, almost scoring 200. The Core i7-2600K, due to its lack of instruction support, sits in the corner.


176 Comments
View All Comments
Spoelie - Monday, July 24, 2017 - link
On the first page, I assume the green highlight in the processor charts signifies an advantage for that side. Why are the cores/threads rows in the Ryzen side not highlighted? Or is 8/16 not better than 4/8?Ian Cutress - Monday, July 24, 2017 - link
Derp. Fixed.Gothmoth - Monday, July 24, 2017 - link
intel must really push money into anandtech. :) so many interesting things to report about and they spend time on a niche product.....Ian Cutress - Monday, July 24, 2017 - link
This has been in the works for a while because our CPU failed. I work on the CPU stuff - other editors work on other things ;) If you've got an idea, reach out to us. I can never guarantee anything (I've got 10+ ideas that I don't have time to do) but if it's interesting we'll see what we can do. Plus it helps us direct what other content we should be doing.halcyon - Monday, July 24, 2017 - link
This is an amazing amount of benchmarking with many options. thank you. Must have been a lot of work :-)The obvious idea is this:
Gaming (modern CPU limited and most played games) & Productive work (rendering, encoding, 4K video work, R/statistics/Matlab)
Test those under 4c/8t and 8c/16t CPUs both from AMD and Intel - all at most common non-esoteric overlock levels (+/-10%).
This is what many of your readers want:
How much does c. 5Ghz 4c/8t do vs 4.x Ghz 8c/16t when taken to it's everyday stable extreme, in modern games / productivity.
The web is already full of benchmarks at stock speed. Or overclocked Ryzen R 7 against stock Intel, or OC intel against overclocked Ryzen - and the game/app selections are not very varied.
The result is a simple graph that plots the (assumed) linear trend in performance/price and shows any deviations below/above the linear trend.
Of course, if you already have the Coffee lake 6c/12t sample, just skip the 4c/8t and go with 6c/12t vs 8c/16 comparision.
Thanks for all the hard work throughout all these years!
Ryan Smith - Monday, July 24, 2017 - link
"so many interesting things to report about and they spend time on a niche product....."What can we say? CPUs have been our favorite subject for the last 20 years.=)
user_5447 - Monday, July 24, 2017 - link
"For 2017, Intel is steering the ship in a slightly different direction, and launching the latest microarchitecture on the HEDT platform."Skylake-S, Kaby Lake-S and Kaby Lake-X share the same microarchitecture, right?
Then Skylake-X is newer microarchitecture than Kaby Lake-X (changes to L2 and L3 caches, AVX-512).
Ian Cutress - Monday, July 24, 2017 - link
Correct me if I'm wrong: SKL-SP cores are derived from SKL-S, and 14nm. KBL-S/X are 14+, and shares most of its design with SKL-S, and the main changes are power related. Underneath there's no real performance (except Speed Shift v2), but Intel classifies Kaby Lake as its latest non-AVX512 IPC microarchitecture.user_5447 - Monday, July 24, 2017 - link
Kaby Lake-S has some errata fixes compared to Skylake-S. AFAIK, this is the only change to the CPU core (besides the Speed Shift v2, if it even involved hardware changes).David Kanter says Skylake-X/EP is 14+ nm http://www.realworldtech.com/forum/?threadid=16889...
extide - Wednesday, July 26, 2017 - link
I have a buddy who works in the fabs -- SKL-X is still on plain 14nm