The Intel Kaby Lake-X i7 7740X and i5 7640X Review: The New Single-Threaded Champion, OC to 5GHz
by Ian Cutress on July 24, 2017 8:30 AM EST- Posted in
- CPUs
- Intel
- Kaby Lake
- X299
- Basin Falls
- Kaby Lake-X
- i7-7740X
- i5-7640X
Rise of the Tomb Raider
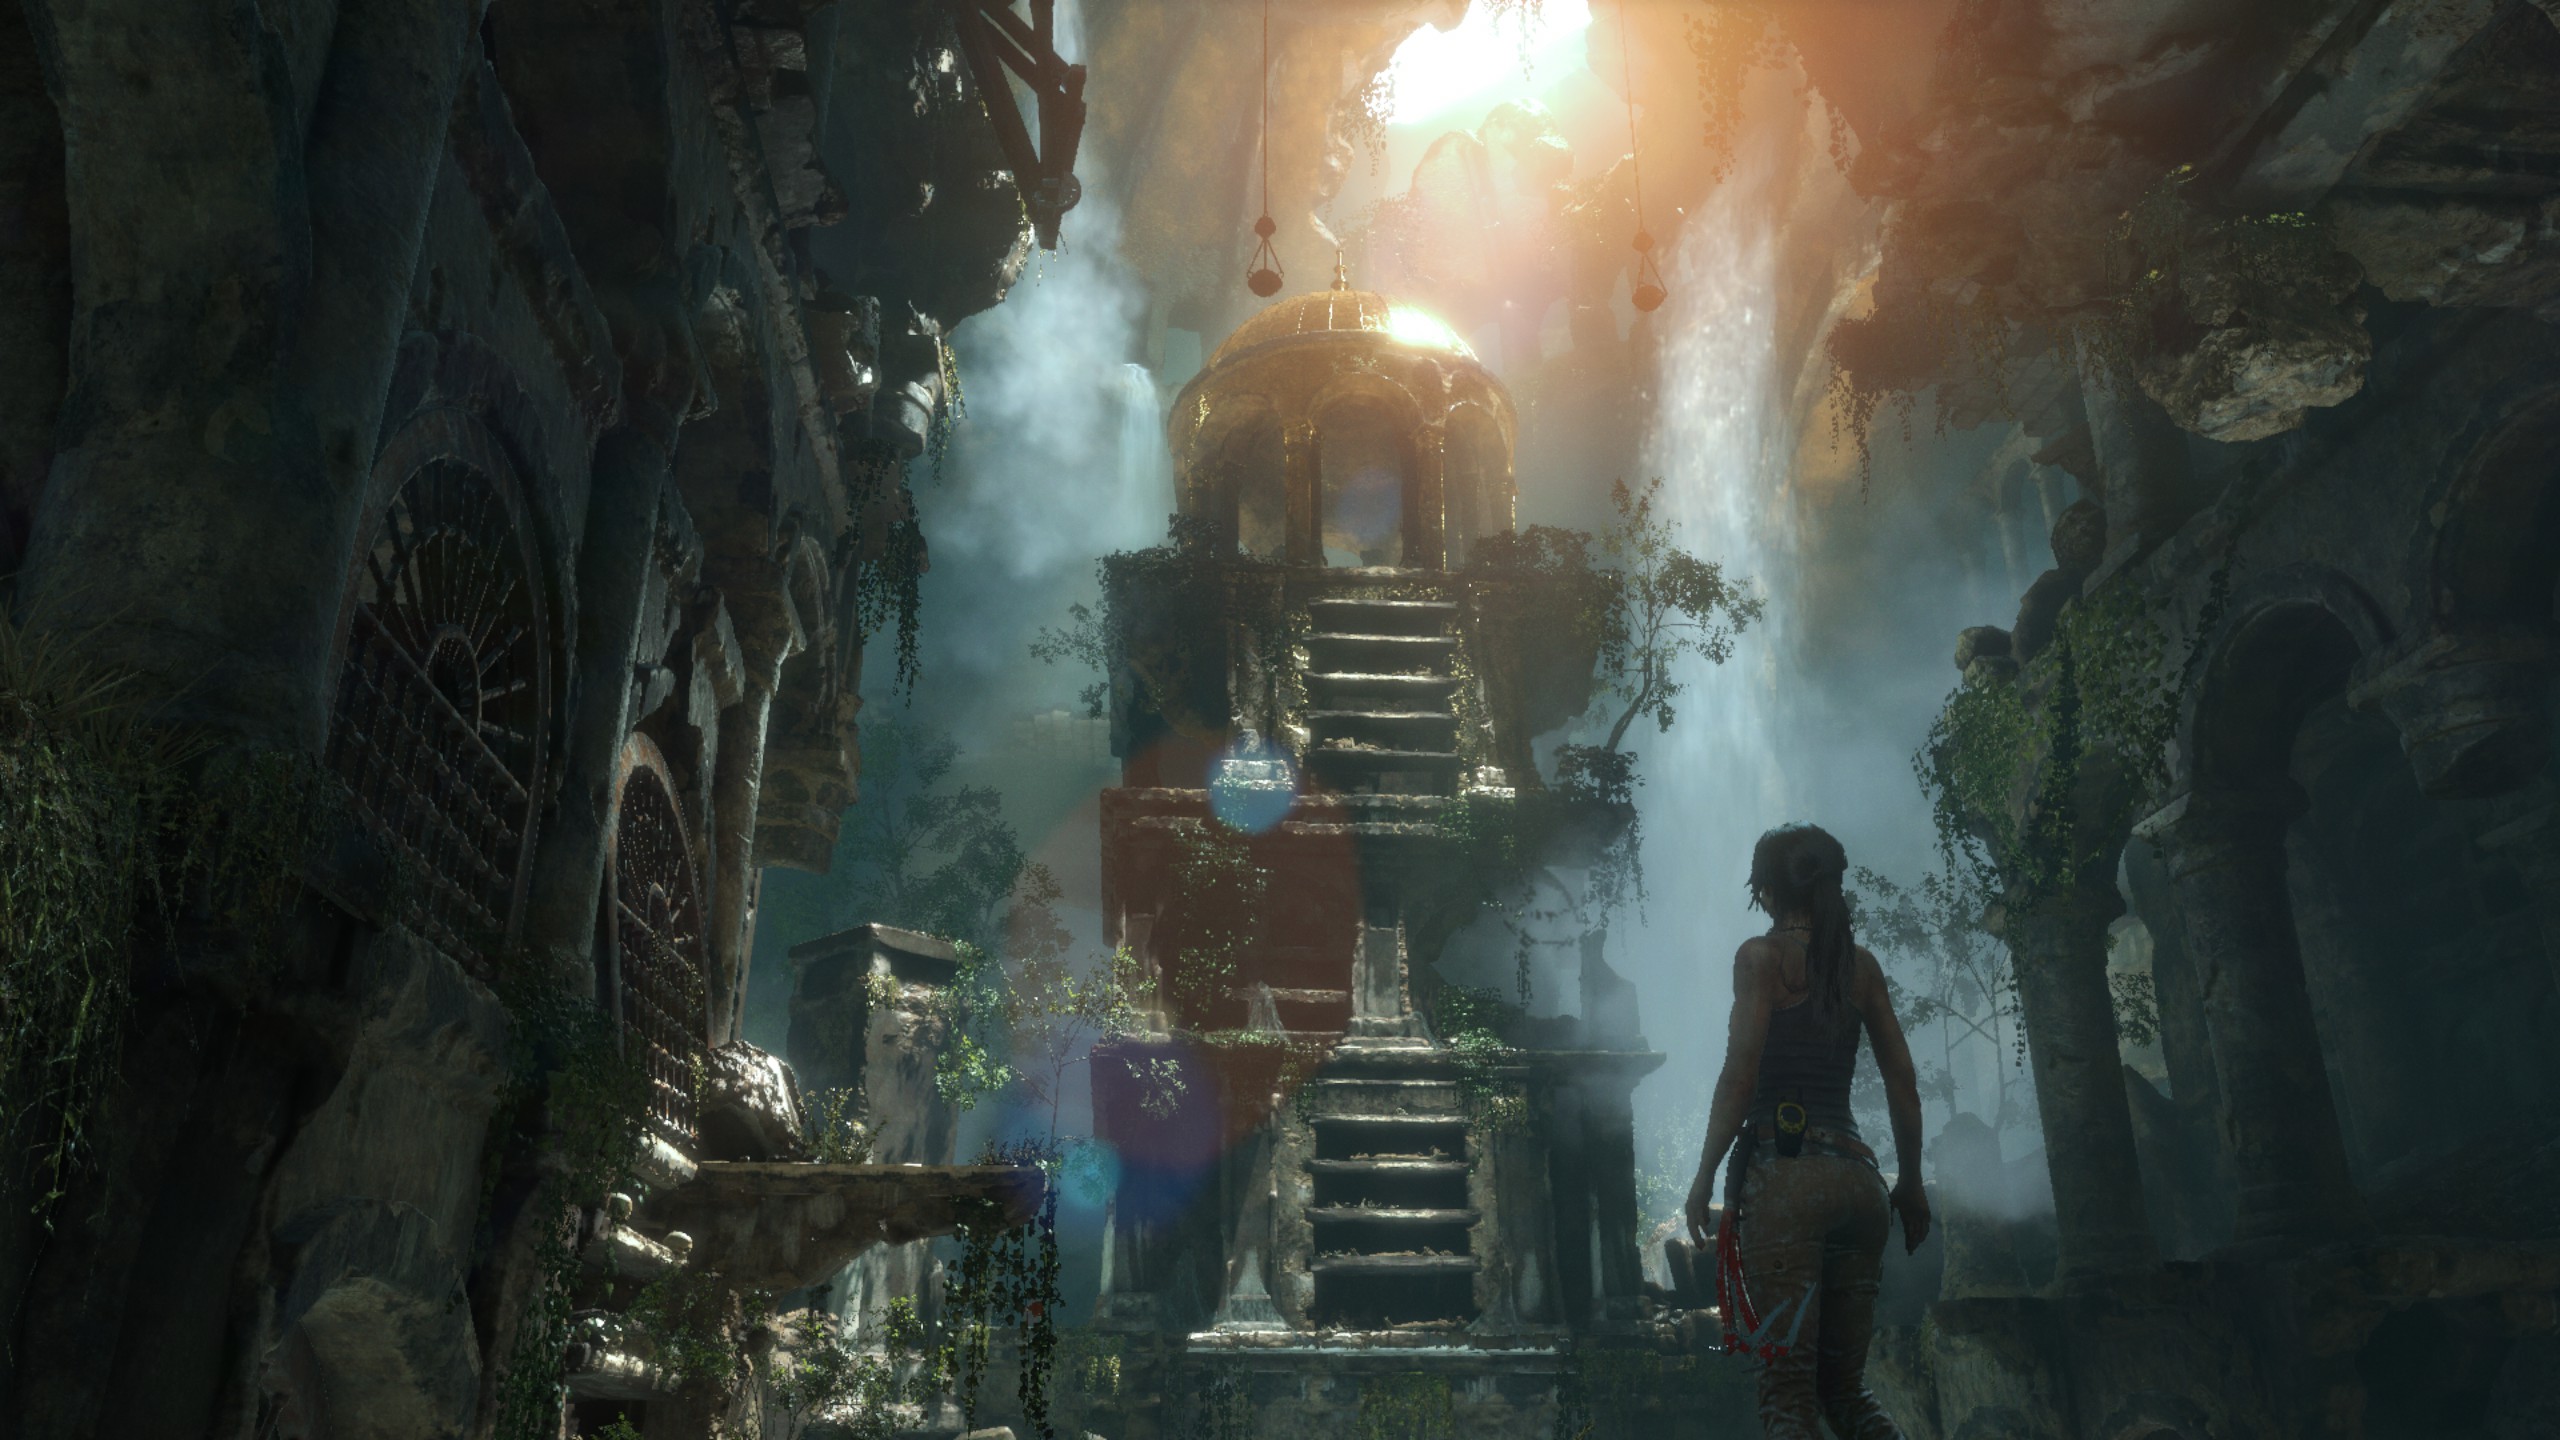
One of the newest games in the gaming benchmark suite is Rise of the Tomb Raider (RoTR), developed by Crystal Dynamics, and the sequel to the popular Tomb Raider which was loved for its automated benchmark mode. But don’t let that fool you: the benchmark mode in RoTR is very much different this time around.
Visually, the previous Tomb Raider pushed realism to the limits with features such as TressFX, and the new RoTR goes one stage further when it comes to graphics fidelity. This leads to an interesting set of requirements in hardware: some sections of the game are typically GPU limited, whereas others with a lot of long-range physics can be CPU limited, depending on how the driver can translate the DirectX 12 workload.
Where the old game had one benchmark scene, the new game has three different scenes with different requirements: Geothermal Valley (1-Valley), Prophet’s Tomb (2-Prophet) and Spine of the Mountain (3-Mountain) - and we test all three. These are three scenes designed to be taken from the game, but it has been noted that scenes like 2-Prophet shown in the benchmark can be the most CPU limited elements of that entire level, and the scene shown is only a small portion of that level. Because of this, we report the results for each scene on each graphics card separately.

Graphics options for RoTR are similar to other games in this type, offering some presets or allowing the user to configure texture quality, anisotropic filter levels, shadow quality, soft shadows, occlusion, depth of field, tessellation, reflections, foliage, bloom, and features like PureHair which updates on TressFX in the previous game.
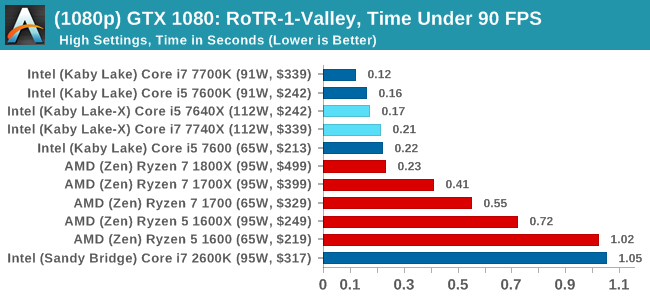
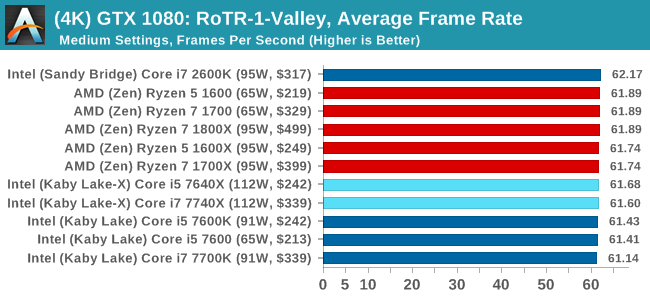
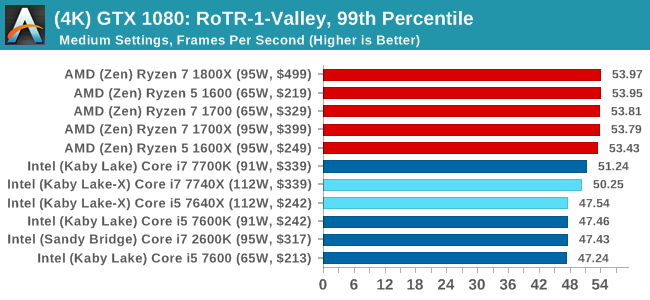
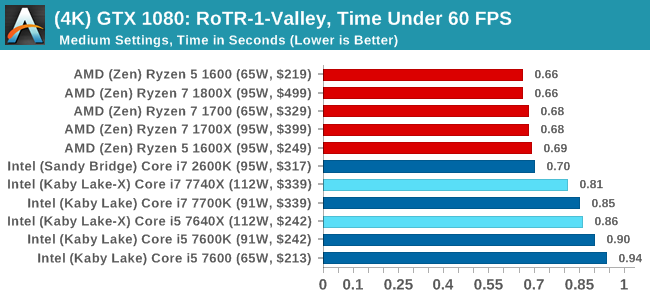
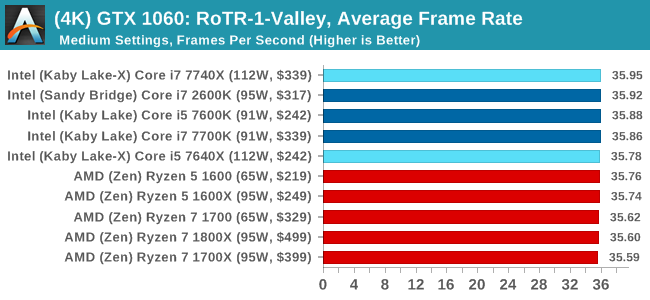
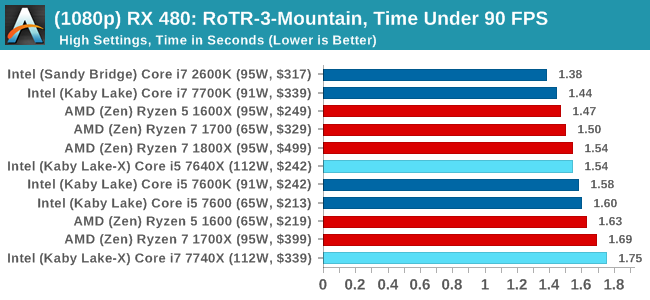
Again, we test at 1920x1080 and 4K using our native 4K displays. At 1080p we run the High preset, while at 4K we use the Medium preset which still takes a sizable hit in frame rate.
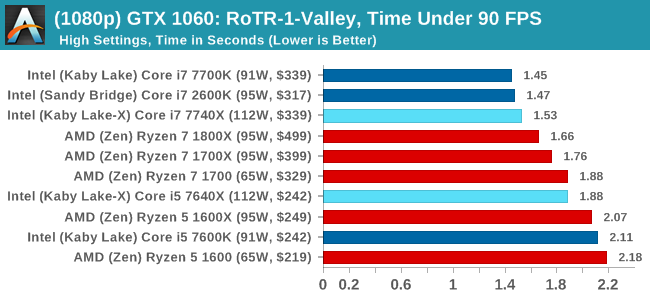
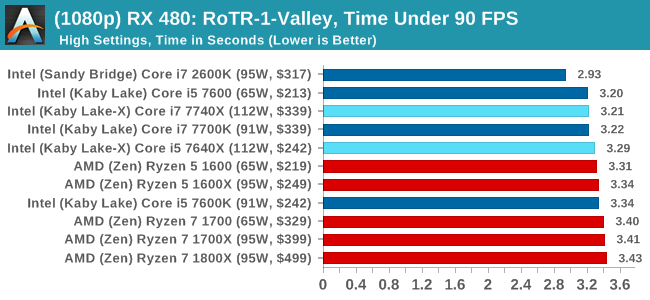
It is worth noting that RoTR is a little different to our other benchmarks in that it keeps its graphics settings in the registry rather than a standard ini file, and unlike the previous TR game the benchmark cannot be called from the command-line. Nonetheless we scripted around these issues to automate the benchmark four times and parse the results. From the frame time data, we report the averages, 99th percentiles, and our time under analysis.
For all our results, we show the average frame rate at 1080p first. Mouse over the other graphs underneath to see 99th percentile frame rates and 'Time Under' graphs, as well as results for other resolutions. All of our benchmark results can also be found in our benchmark engine, Bench.
#1 Geothermal Valley
MSI GTX 1080 Gaming 8G Performance
1080p
4K
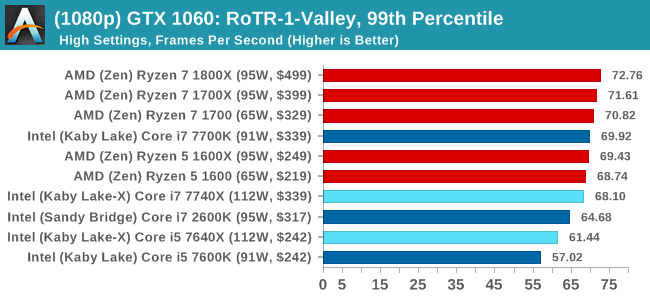
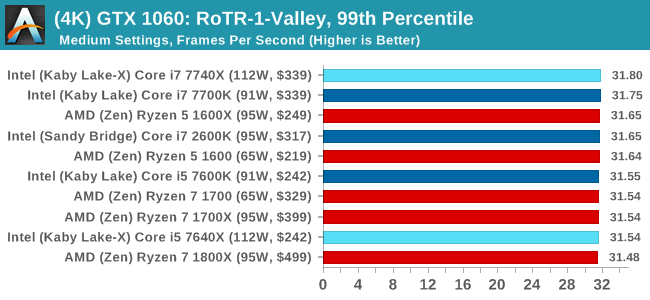
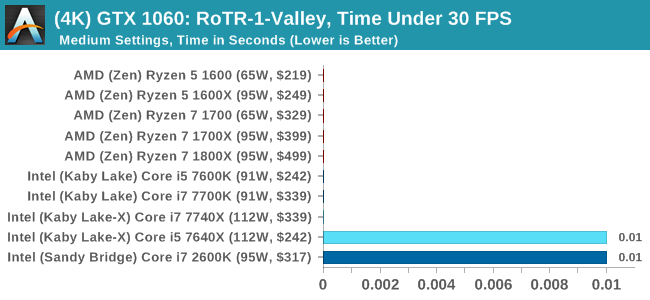
ASUS GTX 1060 Strix 6GB Performance
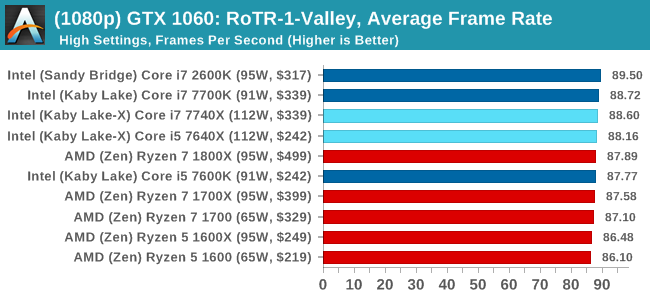
1080p
4K
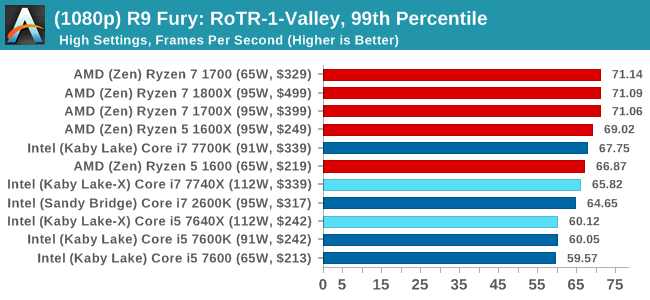
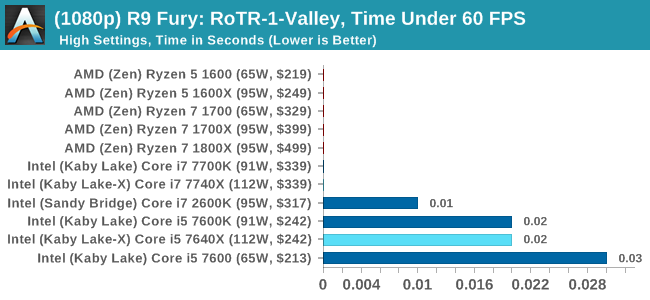
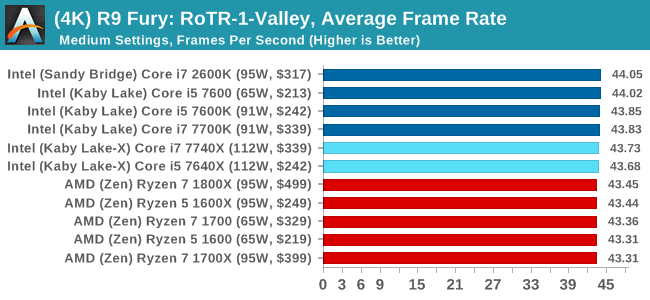
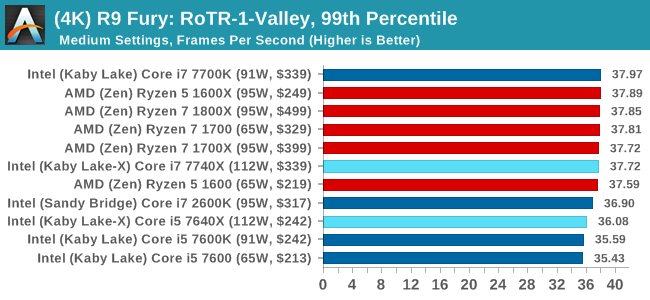
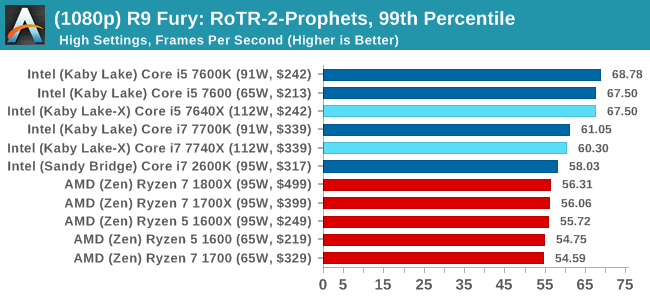
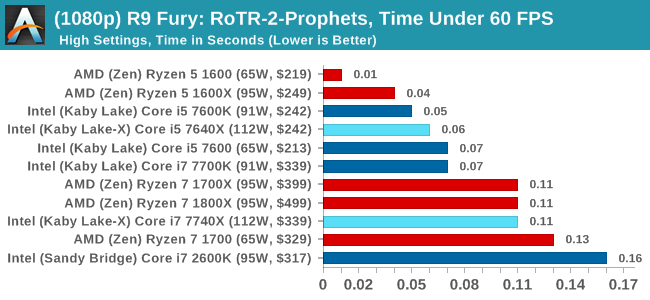
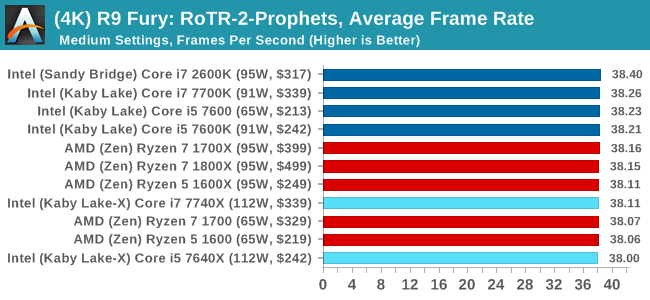
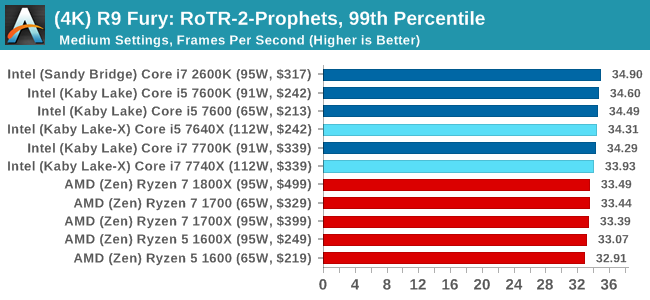
Sapphire R9 Fury 4GB Performance
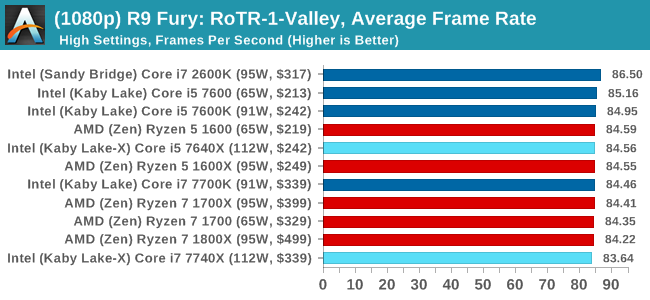
1080p
4K
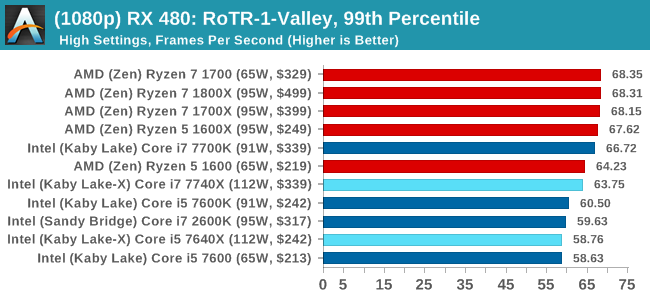
Sapphire RX 480 8GB Performance
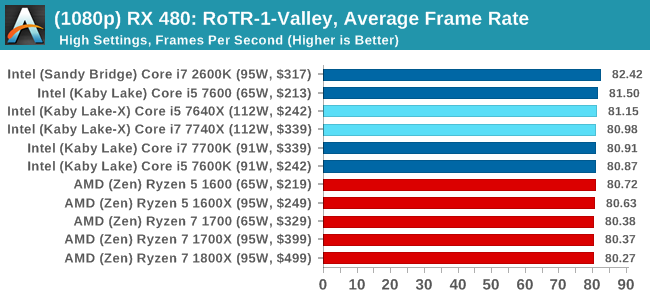
1080p
4K
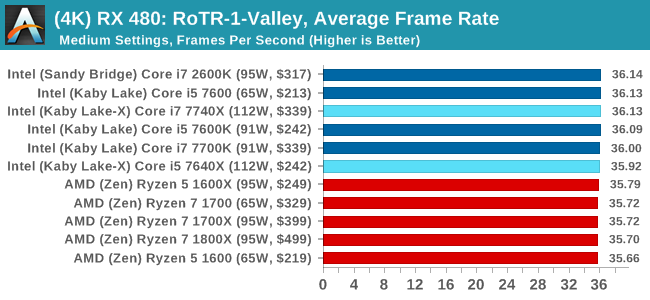
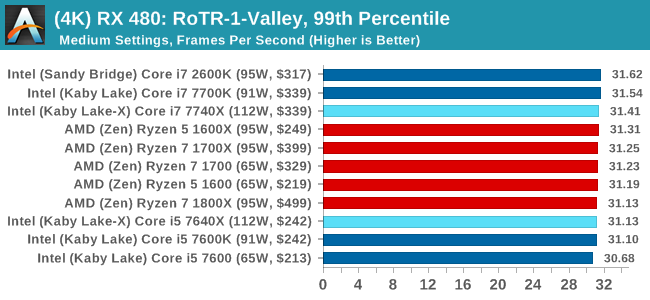
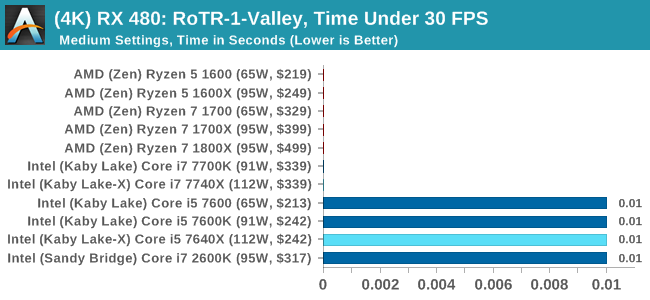
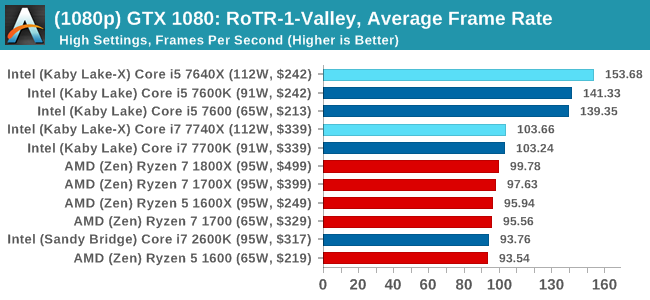
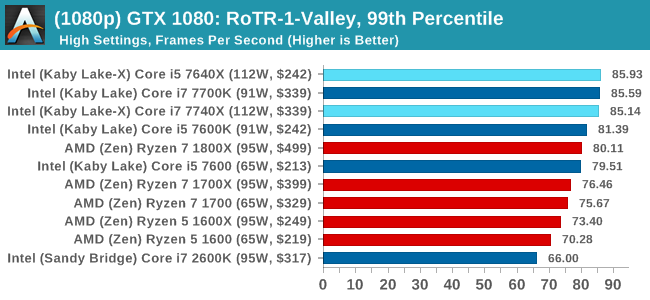
RoTR: Geothermal Valley Conclusions
If we were testing a single GTX 1080 at 1080p, you might think that the graph looks a little odd. All the quad-core, non HT processors (so, the Core i5s) get the best frame rates and percentiles on this specific test on this specific hardware by a good margin. The rest of the tests do not mirror that result though, with the results ping-ponging between Intel and AMD depending on the resolution and the graphics card.
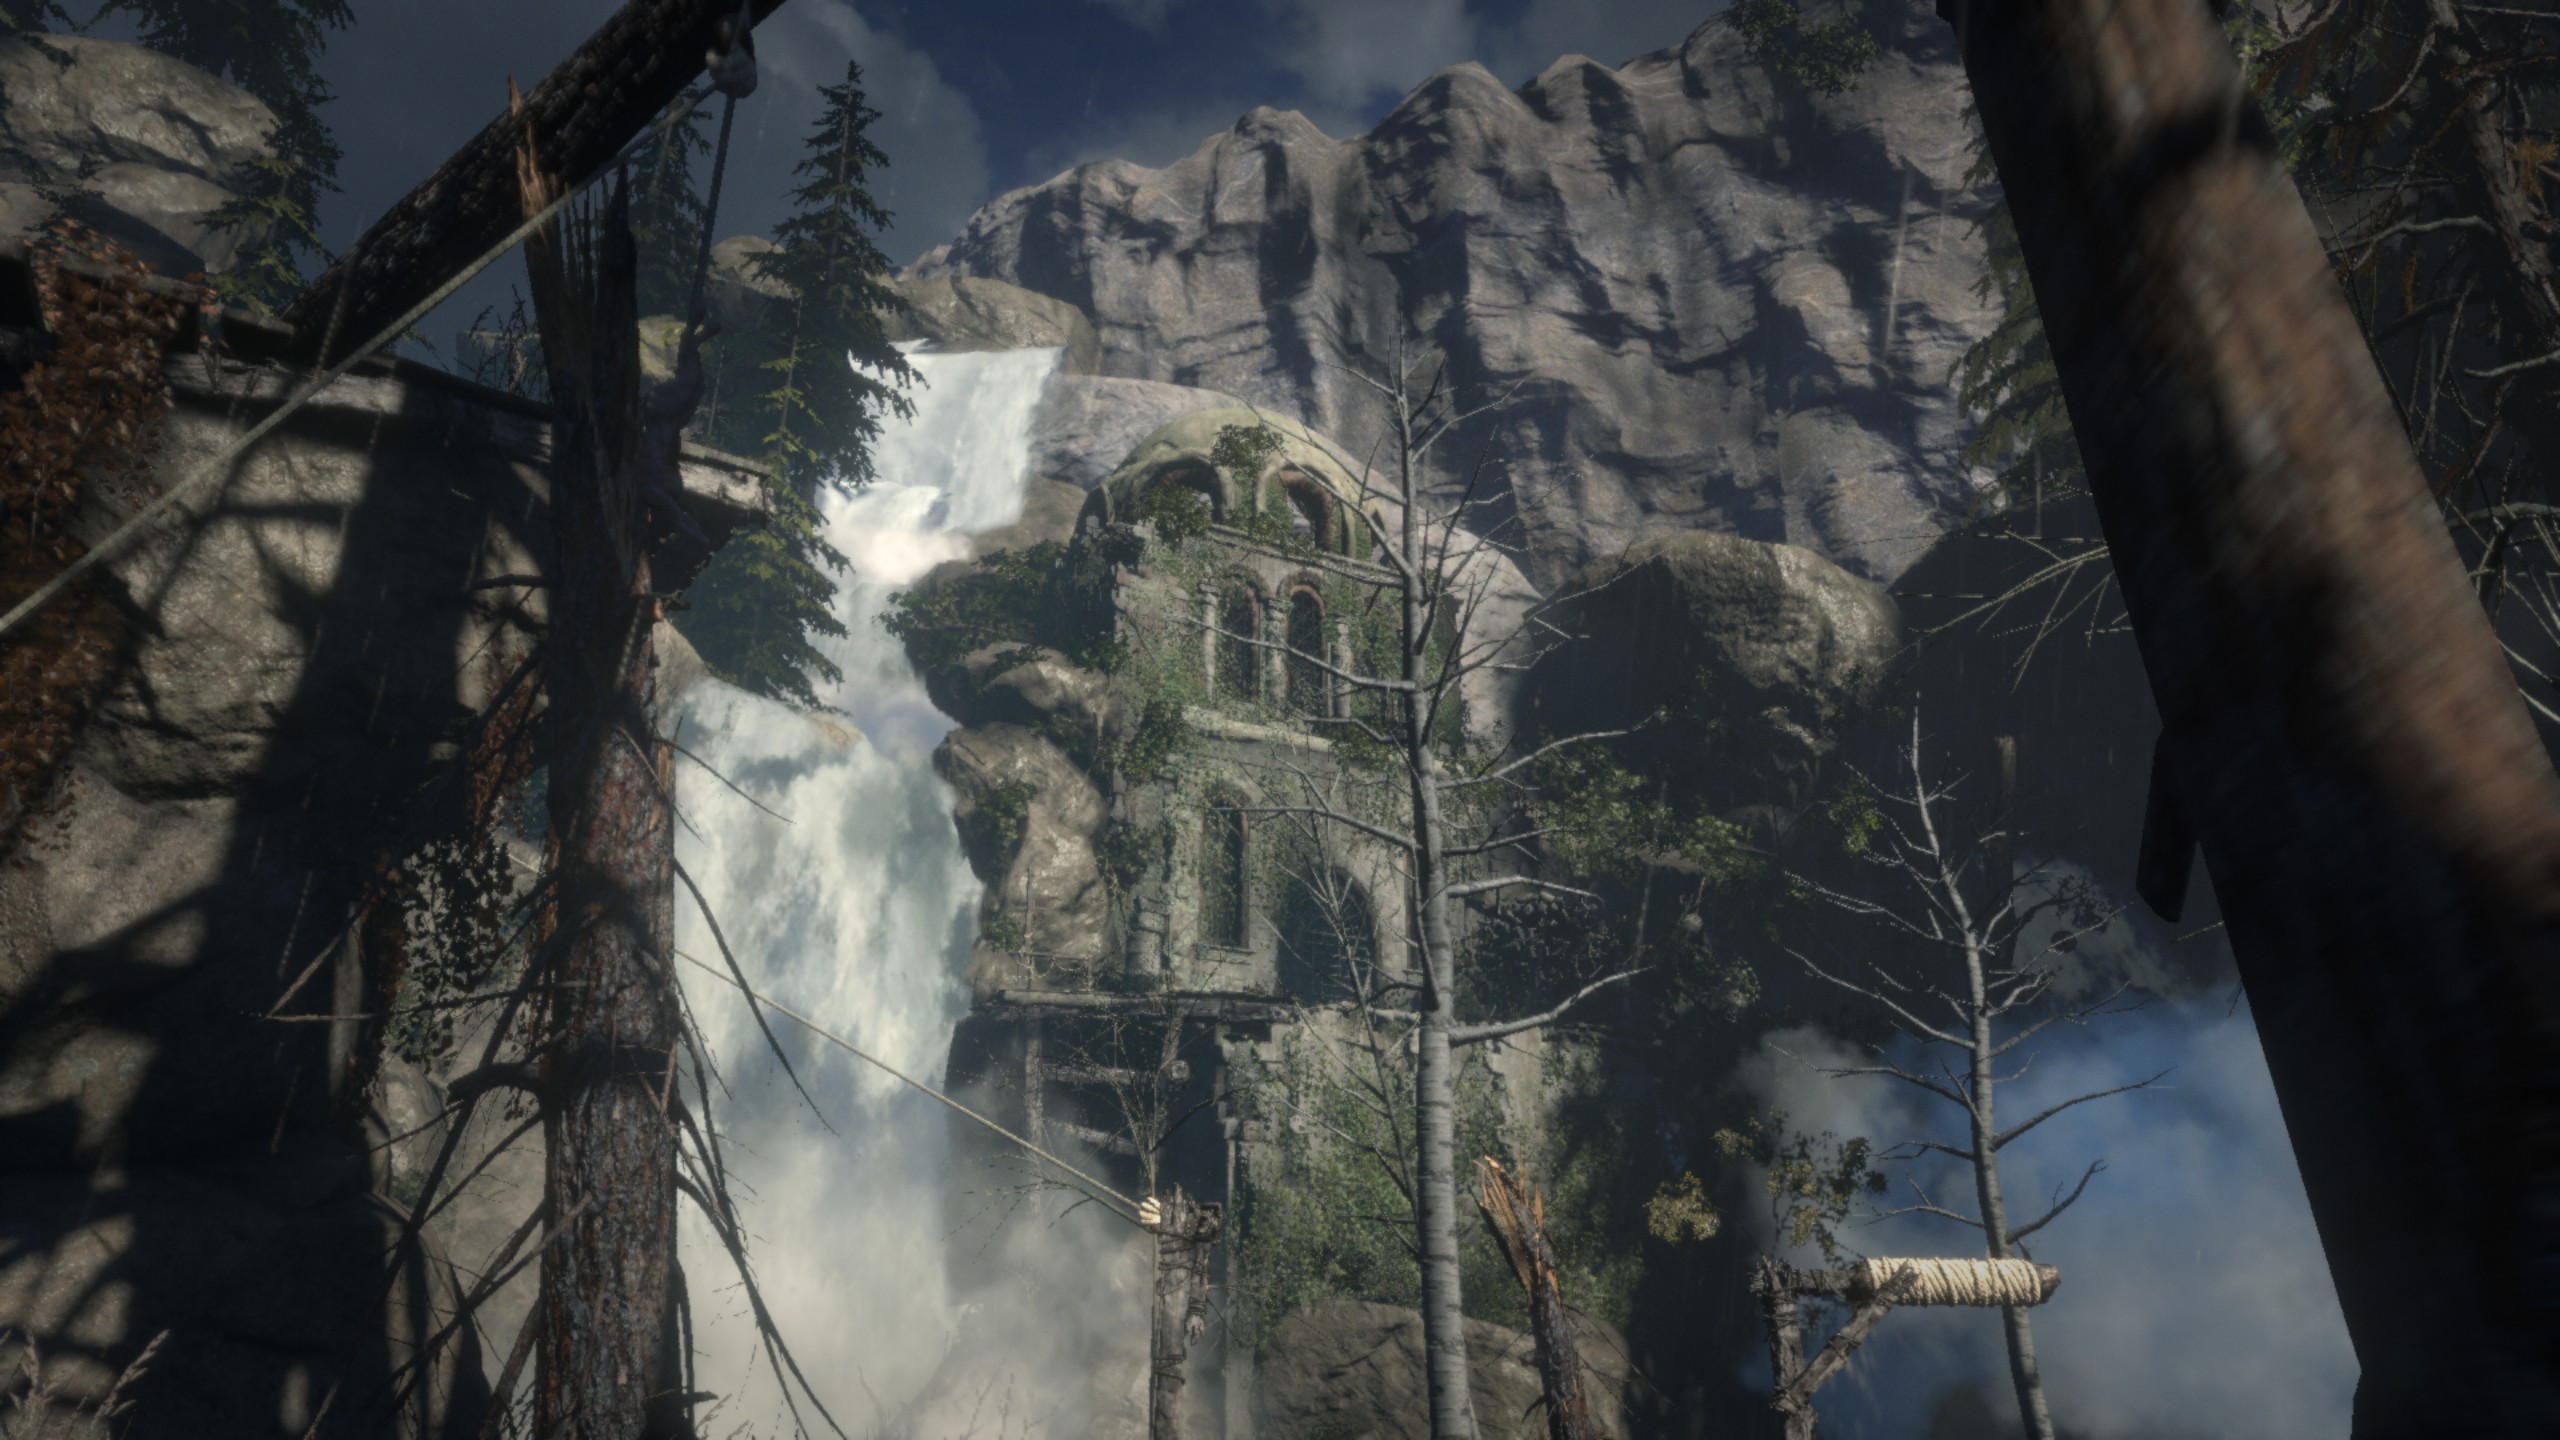
#2 Prophet's Tomb
MSI GTX 1080 Gaming 8G Performance
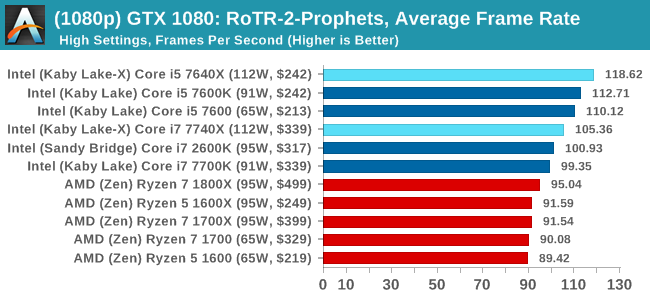
1080p
4K
ASUS GTX 1060 Strix 6GB Performance
1080p
4K
Sapphire R9 Fury 4GB Performance
1080p
4K
Sapphire RX 480 8GB Performance
1080p
4K
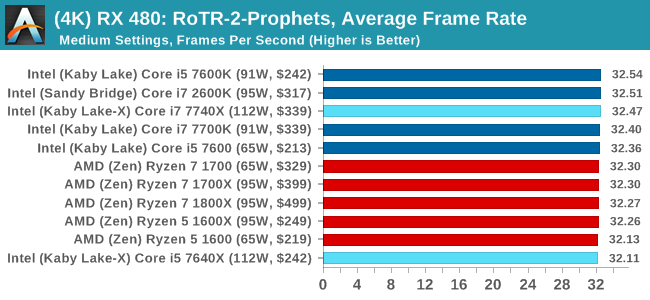
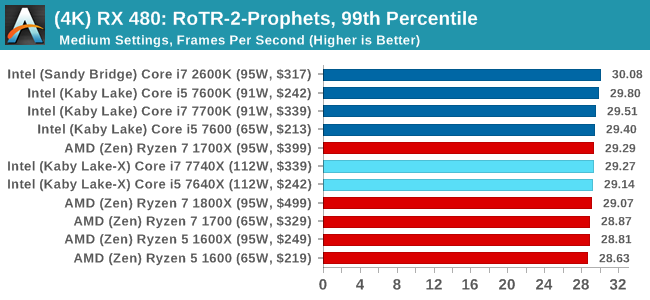
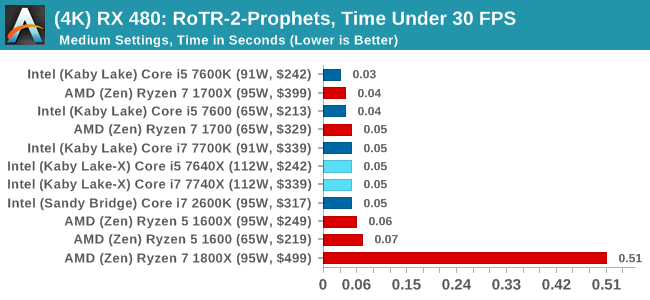
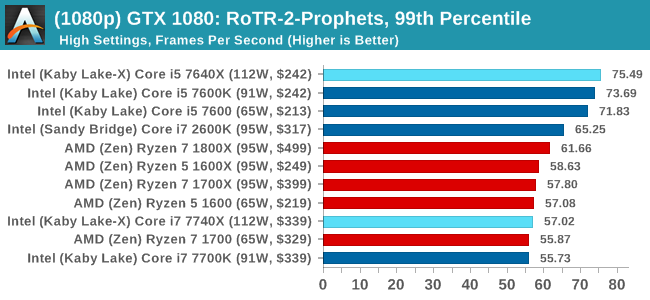
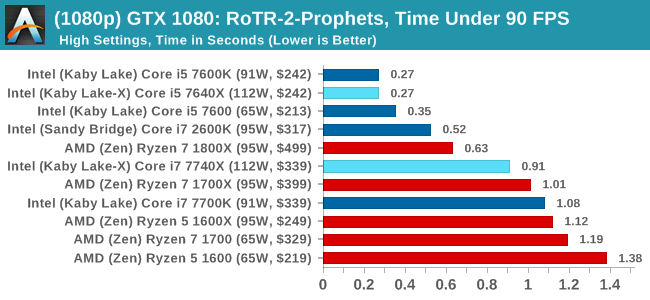
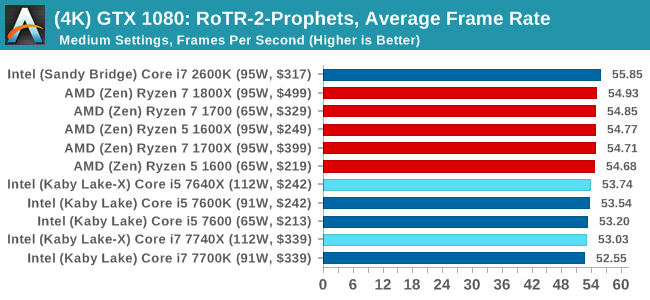
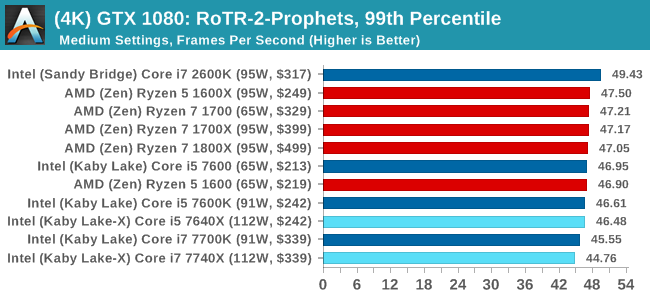
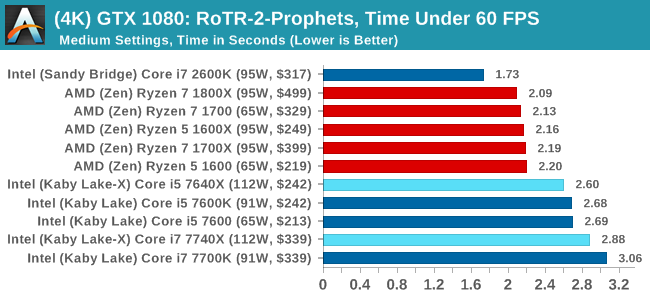
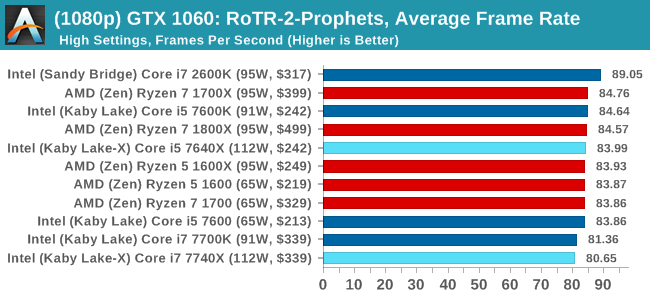
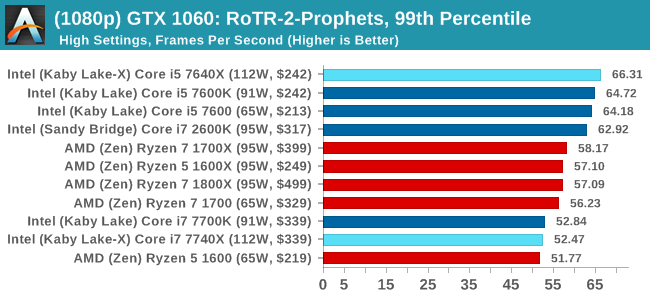
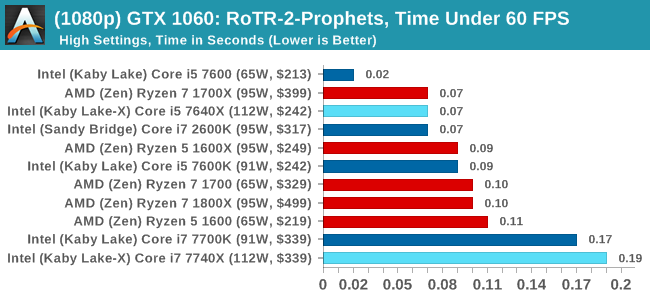
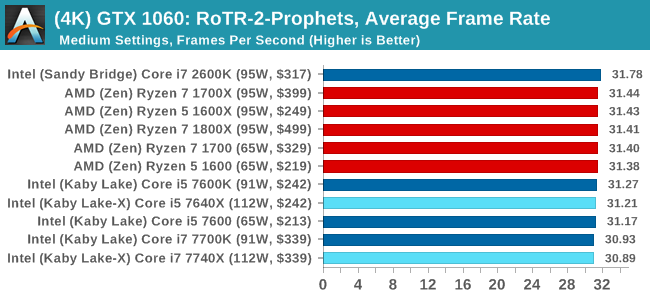
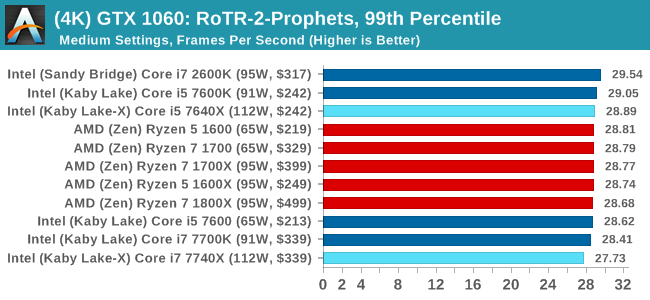
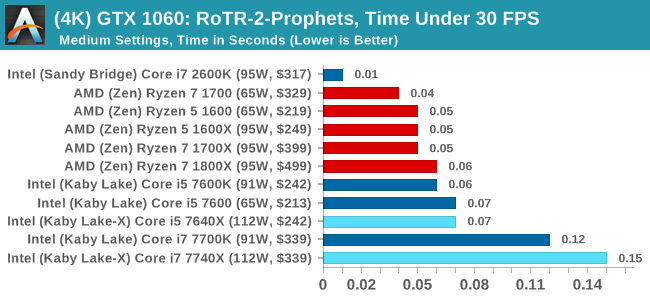
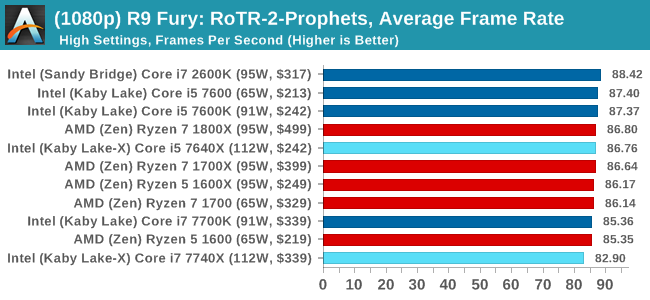
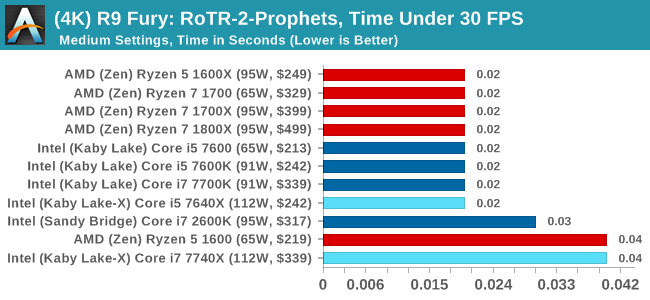
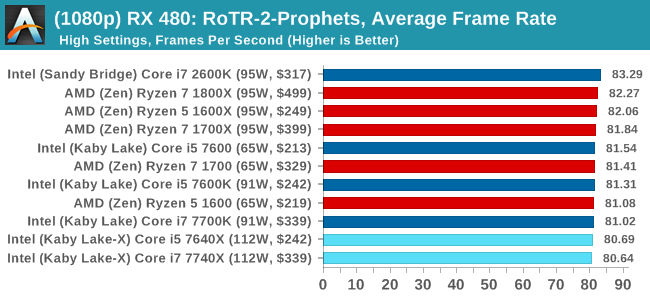
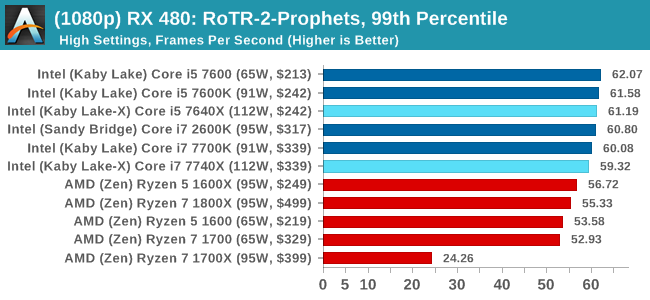
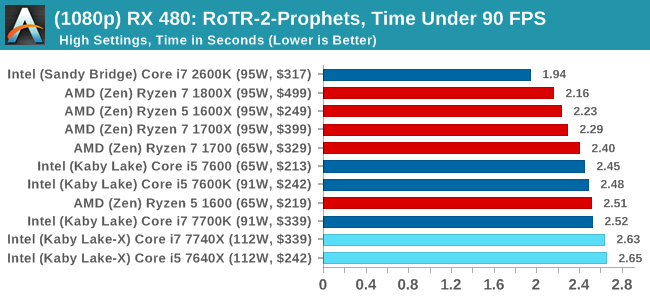
RoTR: Prophet's Tomb Conclusions
For Prophet's Tomb, we again see the Core i5s pull a win at 1080p using the GTX 1080, but the rest of the tests are a mix of results, some siding with AMD and others for Intel. There is the odd outlier in the Time Under analysis, which may warrant further inspection.
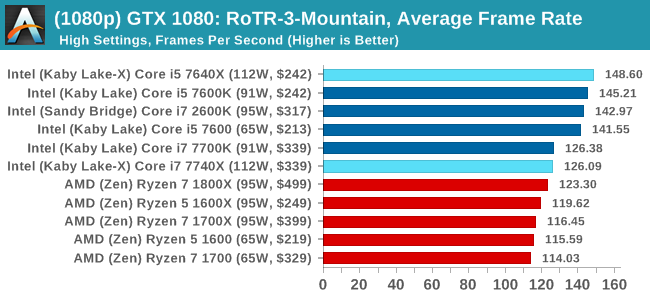
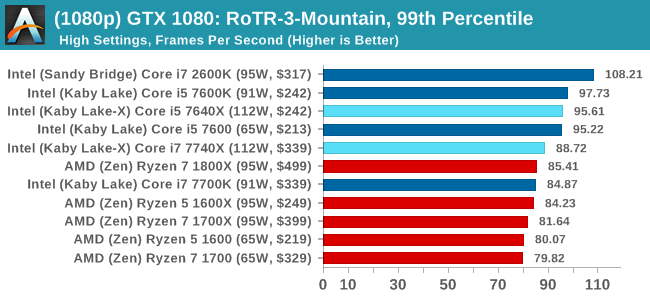
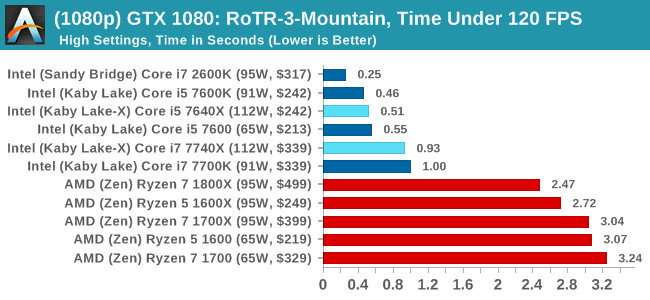
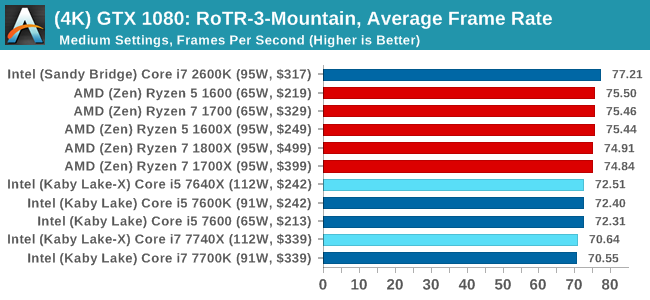
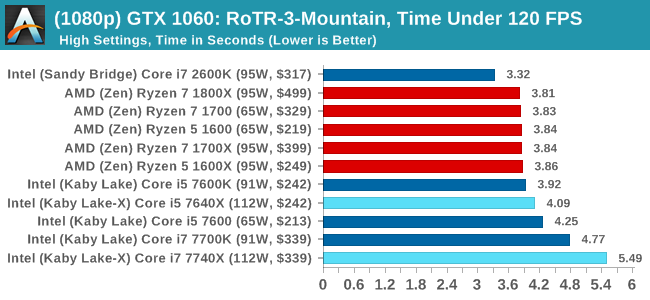
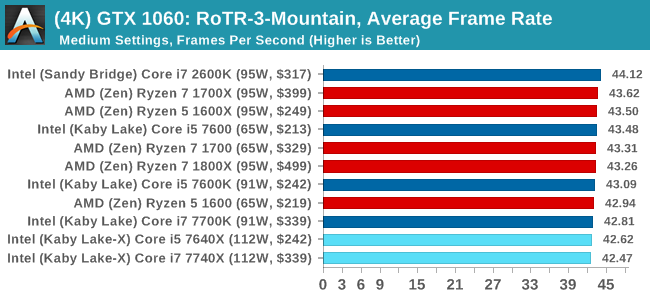
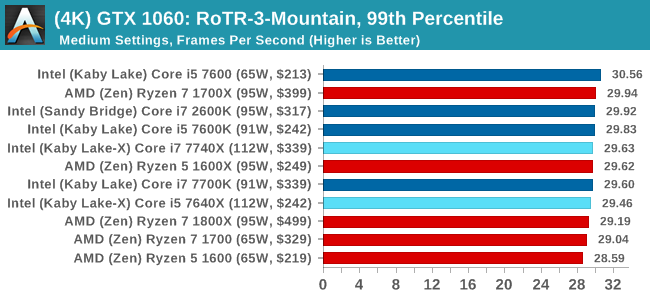
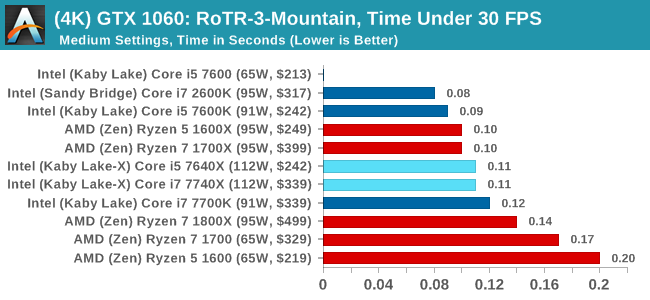
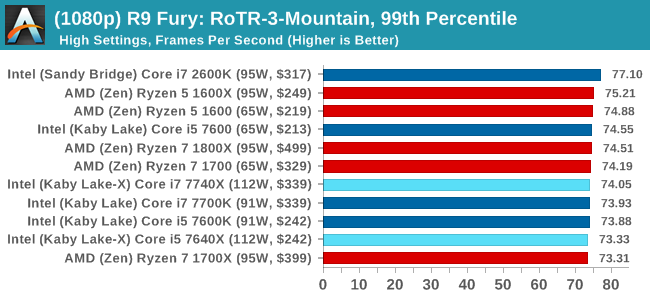
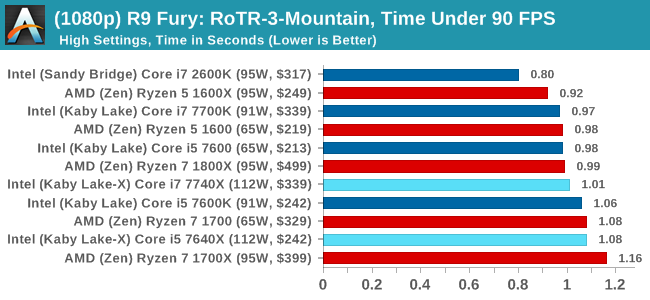
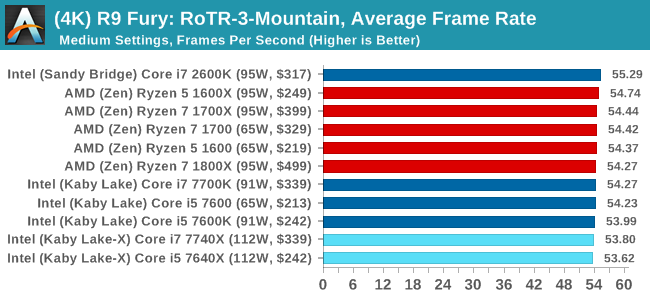
#3 Spine of the Mountain
MSI GTX 1080 Gaming 8G Performance
1080p
4K
ASUS GTX 1060 Strix 6GB Performance
1080p
4K
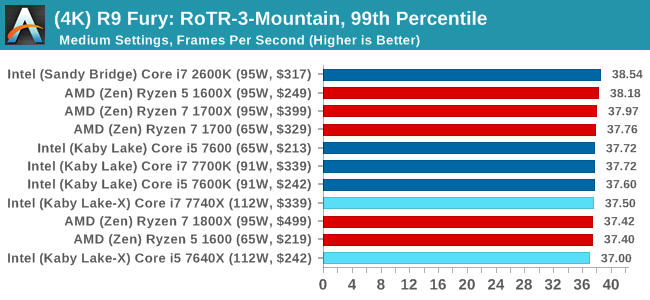
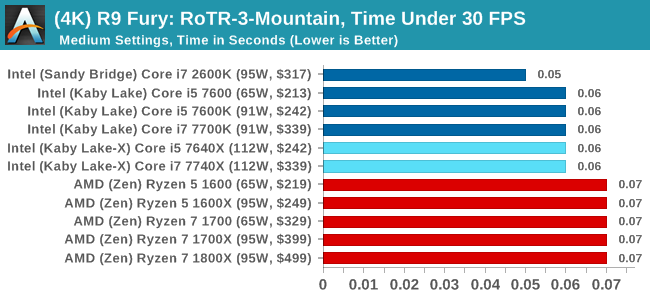
Sapphire R9 Fury 4GB Performance
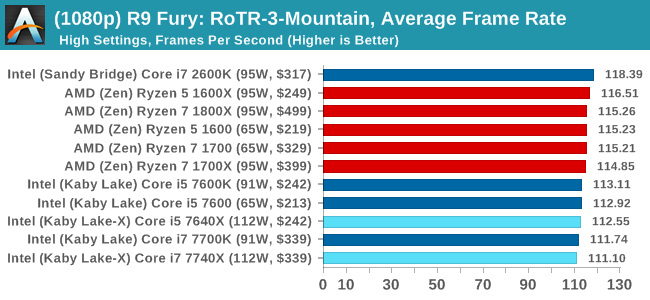
1080p
4K
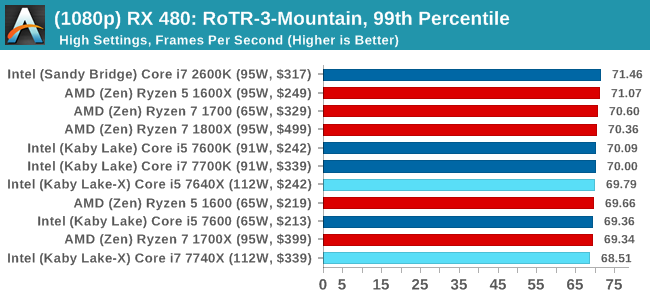
Sapphire RX 480 8GB Performance
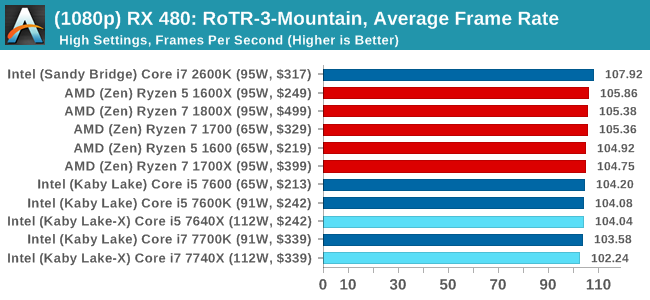
1080p
4K
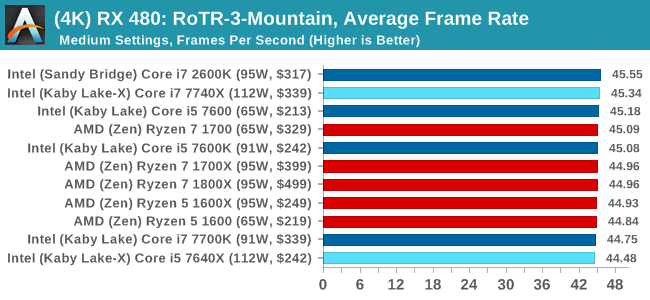
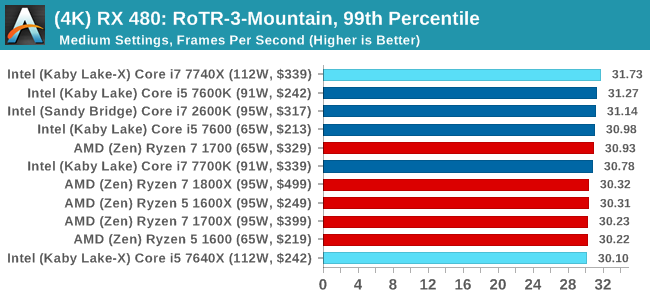
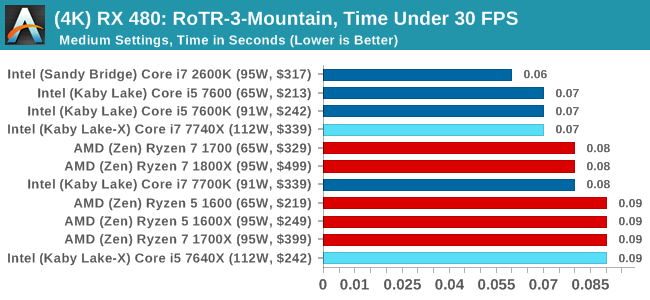
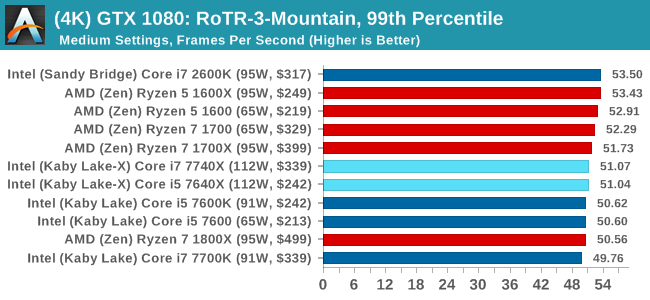
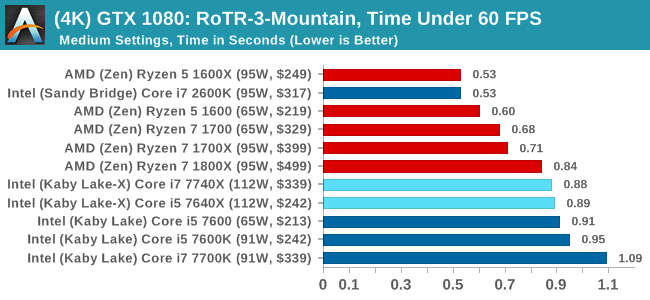
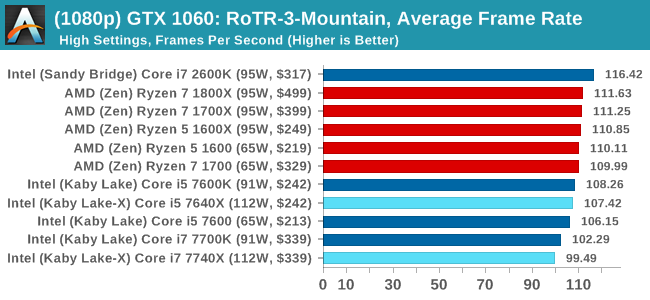
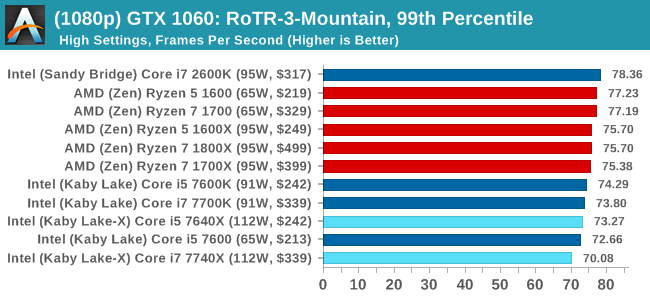
RoTR: Spine of the Mountain Conclusions
Core i5, we're assigning you to run at 1080p with a GTX 1080. That's an order. The rest of you, stand easy.


176 Comments
View All Comments
Spoelie - Monday, July 24, 2017 - link
On the first page, I assume the green highlight in the processor charts signifies an advantage for that side. Why are the cores/threads rows in the Ryzen side not highlighted? Or is 8/16 not better than 4/8?Ian Cutress - Monday, July 24, 2017 - link
Derp. Fixed.Gothmoth - Monday, July 24, 2017 - link
intel must really push money into anandtech. :) so many interesting things to report about and they spend time on a niche product.....Ian Cutress - Monday, July 24, 2017 - link
This has been in the works for a while because our CPU failed. I work on the CPU stuff - other editors work on other things ;) If you've got an idea, reach out to us. I can never guarantee anything (I've got 10+ ideas that I don't have time to do) but if it's interesting we'll see what we can do. Plus it helps us direct what other content we should be doing.halcyon - Monday, July 24, 2017 - link
This is an amazing amount of benchmarking with many options. thank you. Must have been a lot of work :-)The obvious idea is this:
Gaming (modern CPU limited and most played games) & Productive work (rendering, encoding, 4K video work, R/statistics/Matlab)
Test those under 4c/8t and 8c/16t CPUs both from AMD and Intel - all at most common non-esoteric overlock levels (+/-10%).
This is what many of your readers want:
How much does c. 5Ghz 4c/8t do vs 4.x Ghz 8c/16t when taken to it's everyday stable extreme, in modern games / productivity.
The web is already full of benchmarks at stock speed. Or overclocked Ryzen R 7 against stock Intel, or OC intel against overclocked Ryzen - and the game/app selections are not very varied.
The result is a simple graph that plots the (assumed) linear trend in performance/price and shows any deviations below/above the linear trend.
Of course, if you already have the Coffee lake 6c/12t sample, just skip the 4c/8t and go with 6c/12t vs 8c/16 comparision.
Thanks for all the hard work throughout all these years!
Ryan Smith - Monday, July 24, 2017 - link
"so many interesting things to report about and they spend time on a niche product....."What can we say? CPUs have been our favorite subject for the last 20 years.=)
user_5447 - Monday, July 24, 2017 - link
"For 2017, Intel is steering the ship in a slightly different direction, and launching the latest microarchitecture on the HEDT platform."Skylake-S, Kaby Lake-S and Kaby Lake-X share the same microarchitecture, right?
Then Skylake-X is newer microarchitecture than Kaby Lake-X (changes to L2 and L3 caches, AVX-512).
Ian Cutress - Monday, July 24, 2017 - link
Correct me if I'm wrong: SKL-SP cores are derived from SKL-S, and 14nm. KBL-S/X are 14+, and shares most of its design with SKL-S, and the main changes are power related. Underneath there's no real performance (except Speed Shift v2), but Intel classifies Kaby Lake as its latest non-AVX512 IPC microarchitecture.user_5447 - Monday, July 24, 2017 - link
Kaby Lake-S has some errata fixes compared to Skylake-S. AFAIK, this is the only change to the CPU core (besides the Speed Shift v2, if it even involved hardware changes).David Kanter says Skylake-X/EP is 14+ nm http://www.realworldtech.com/forum/?threadid=16889...
extide - Wednesday, July 26, 2017 - link
I have a buddy who works in the fabs -- SKL-X is still on plain 14nm