The Intel Kaby Lake-X i7 7740X and i5 7640X Review: The New Single-Threaded Champion, OC to 5GHz
by Ian Cutress on July 24, 2017 8:30 AM EST- Posted in
- CPUs
- Intel
- Kaby Lake
- X299
- Basin Falls
- Kaby Lake-X
- i7-7740X
- i5-7640X
Ashes of the Singularity: Escalation
Seen as the holy child of DirectX12, Ashes of the Singularity (AoTS, or just Ashes) has been the first title to actively go explore as many of DirectX12s features as it possibly can. Stardock, the developer behind the Nitrous engine which powers the game, has ensured that the real-time strategy title takes advantage of multiple cores and multiple graphics cards, in as many configurations as possible.
As a real-time strategy title, Ashes is all about responsiveness during both wide open shots but also concentrated battles. With DirectX12 at the helm, the ability to implement more draw calls per second allows the engine to work with substantial unit depth and effects that other RTS titles had to rely on combined draw calls to achieve, making some combined unit structures ultimately very rigid.
Stardock clearly understand the importance of an in-game benchmark, ensuring that such a tool was available and capable from day one, especially with all the additional DX12 features used and being able to characterize how they affected the title for the developer was important. The in-game benchmark performs a four minute fixed seed battle environment with a variety of shots, and outputs a vast amount of data to analyze.
For our benchmark, we run a fixed v2.11 version of the game due to some peculiarities of the splash screen added after the merger with the standalone Escalation expansion, and have an automated tool to call the benchmark on the command line. (Prior to v2.11, the benchmark also supported 8K/16K testing, however v2.11 has odd behavior which nukes this.)
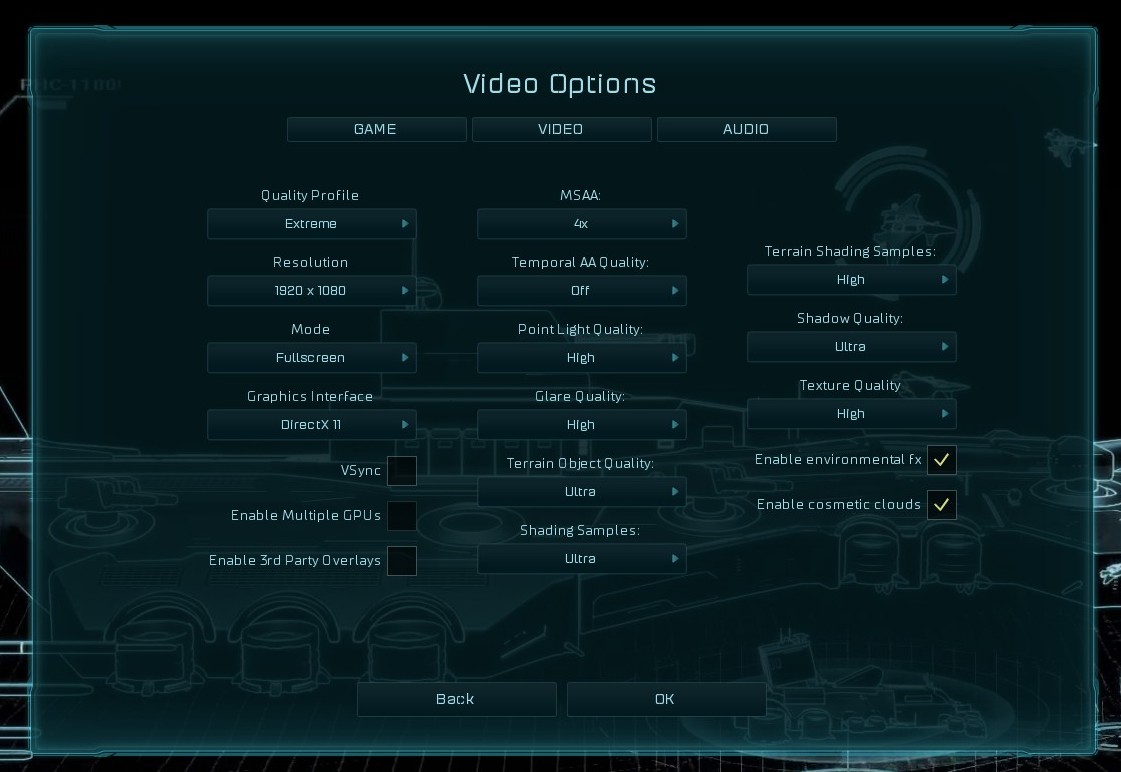
At both 1920x1080 and 4K resolutions, we run the same settings. Ashes has dropdown options for MSAA, Light Quality, Object Quality, Shading Samples, Shadow Quality, Textures, and separate options for the terrain. There are several presents, from Very Low to Extreme: we run our benchmarks at Extreme settings, and take the frame-time output for our average, percentile, and time under analysis.
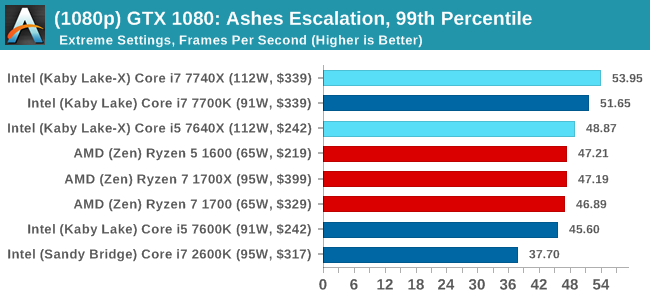
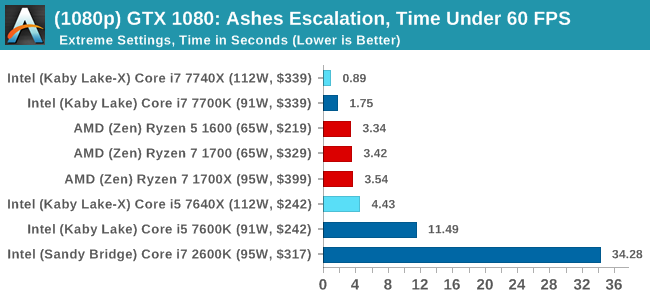
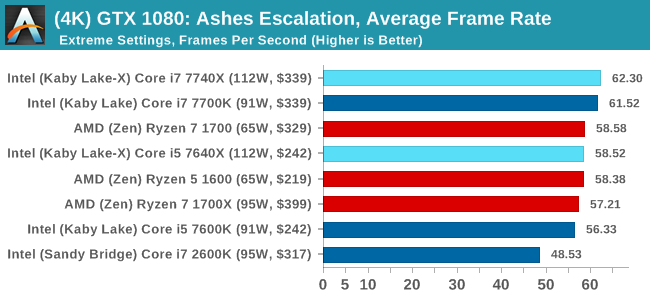
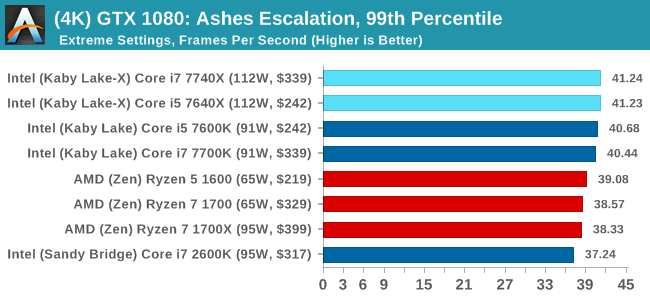
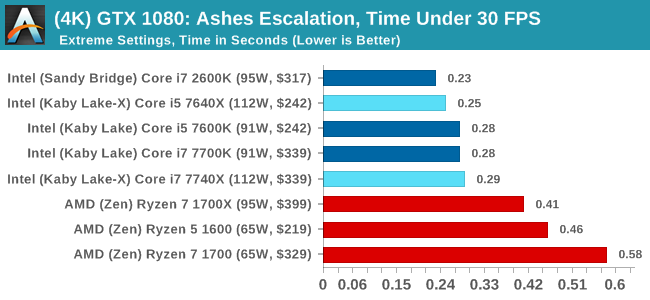
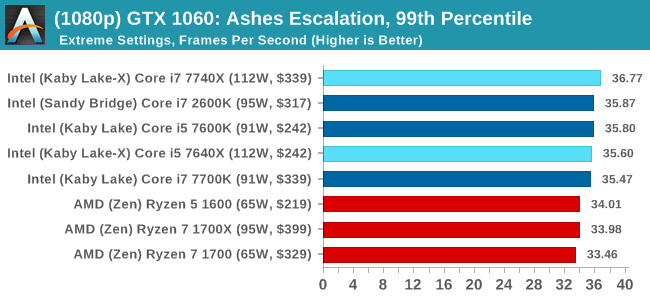
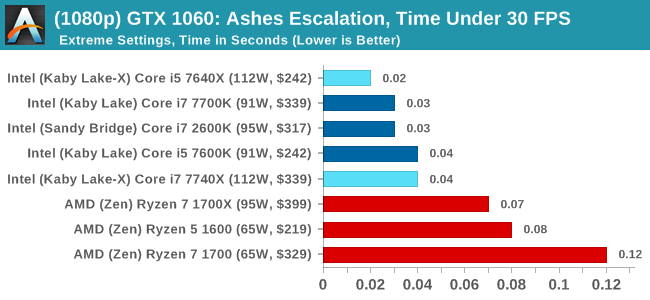
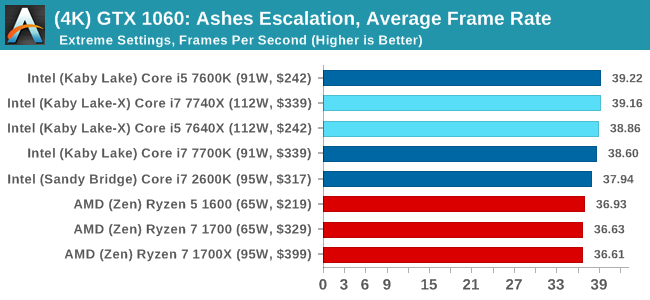
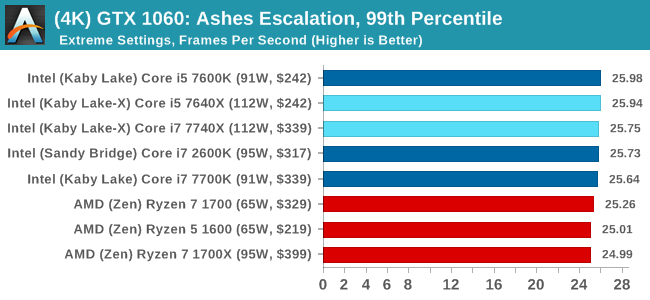
For all our results, we show the average frame rate at 1080p first. Mouse over the other graphs underneath to see 99th percentile frame rates and 'Time Under' graphs, as well as results for other resolutions. All of our benchmark results can also be found in our benchmark engine, Bench.
MSI GTX 1080 Gaming 8G Performance
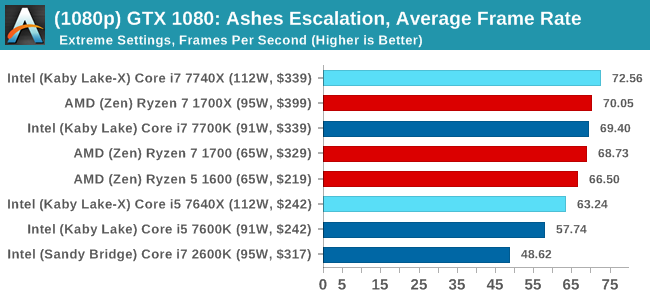
1080p
4K
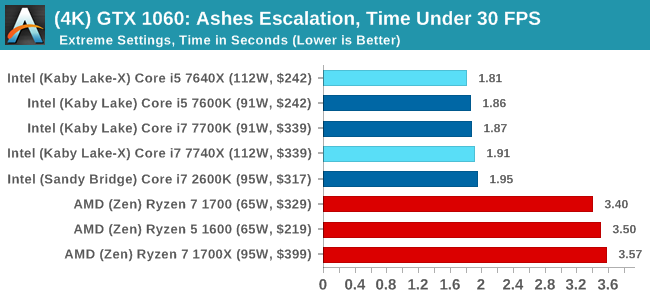
ASUS GTX 1060 Strix 6GB Performance

1080p
4K
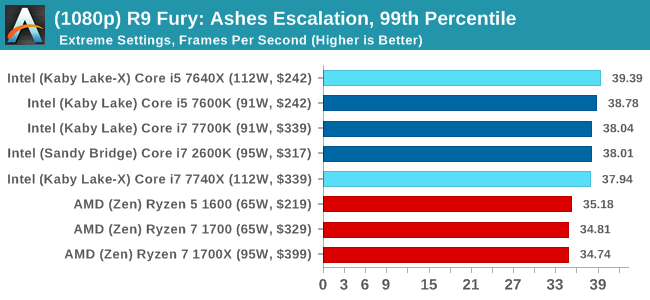
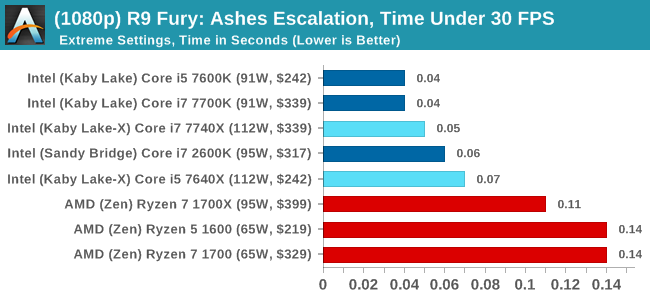
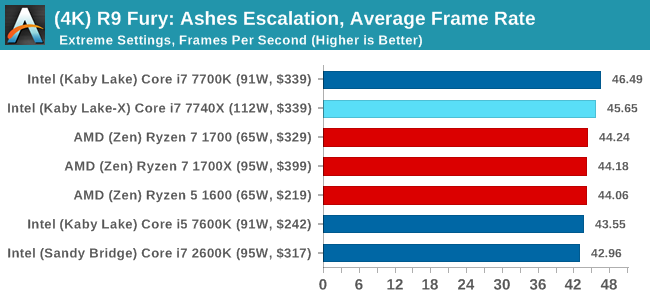
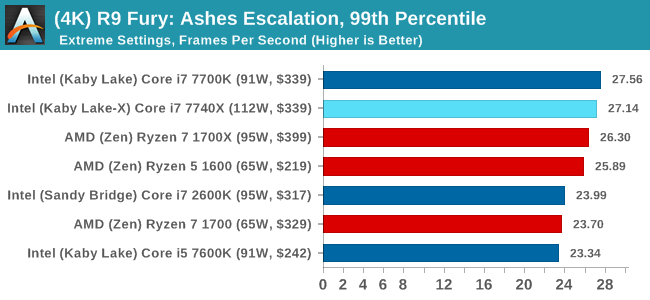
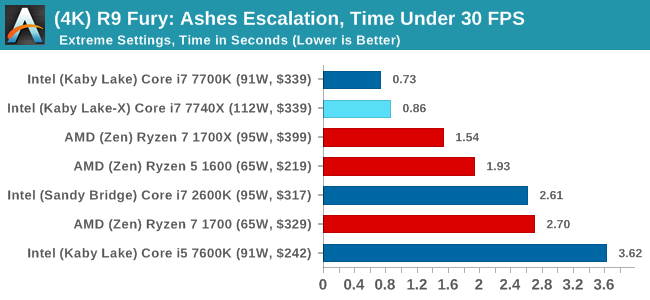
Sapphire R9 Fury 4GB Performance
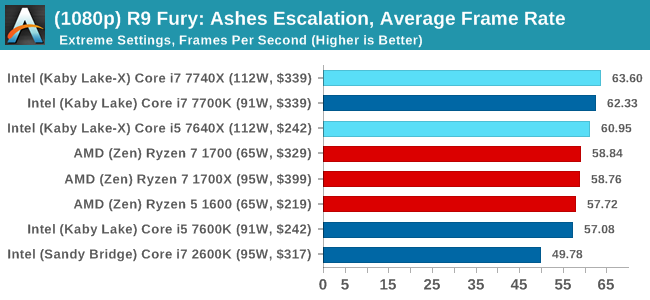
1080p
4K
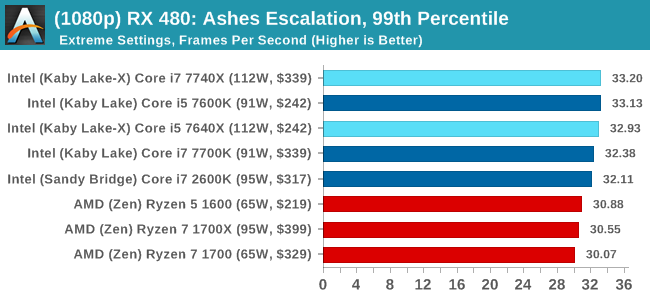
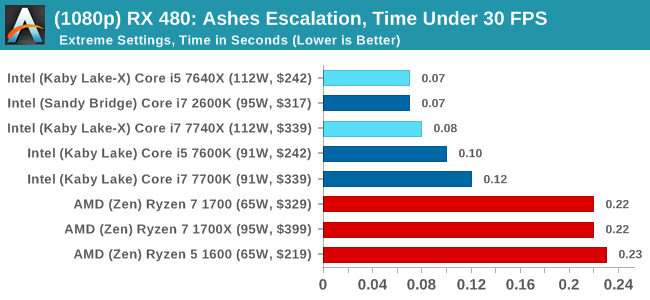
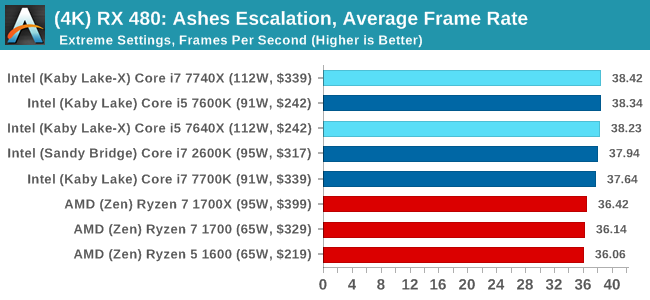
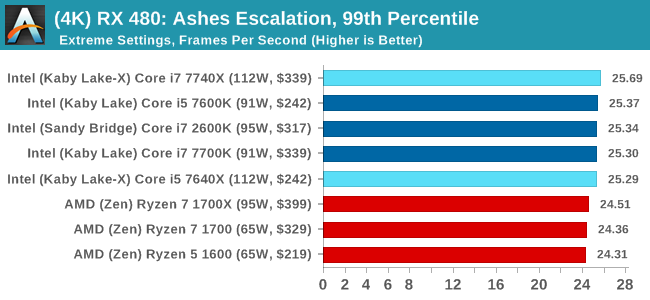
Sapphire RX 480 8GB Performance
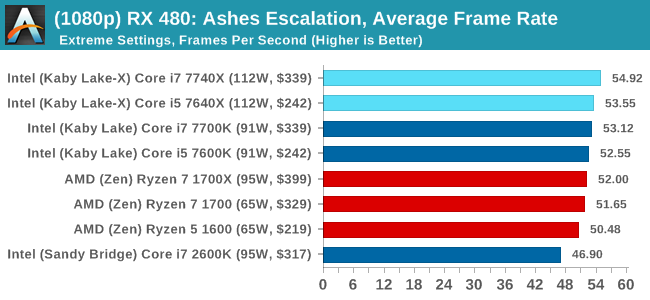
1080p
4K
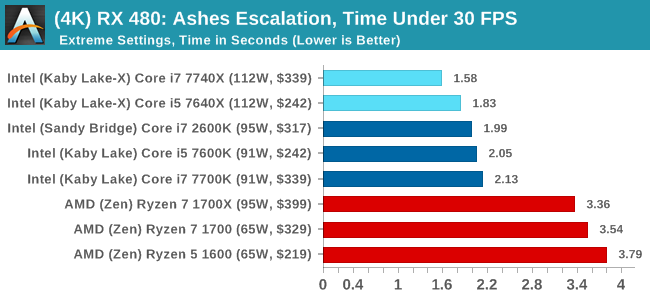
Ashes Conclusion
Pretty much across the board, no matter the GPU or the resolution, Intel gets the win here. This is most noticable in the time under analysis, although AMD seems to do better when the faster cards are running at the lower resolution. That's nothing to brag about though.


176 Comments
View All Comments
Spoelie - Monday, July 24, 2017 - link
On the first page, I assume the green highlight in the processor charts signifies an advantage for that side. Why are the cores/threads rows in the Ryzen side not highlighted? Or is 8/16 not better than 4/8?Ian Cutress - Monday, July 24, 2017 - link
Derp. Fixed.Gothmoth - Monday, July 24, 2017 - link
intel must really push money into anandtech. :) so many interesting things to report about and they spend time on a niche product.....Ian Cutress - Monday, July 24, 2017 - link
This has been in the works for a while because our CPU failed. I work on the CPU stuff - other editors work on other things ;) If you've got an idea, reach out to us. I can never guarantee anything (I've got 10+ ideas that I don't have time to do) but if it's interesting we'll see what we can do. Plus it helps us direct what other content we should be doing.halcyon - Monday, July 24, 2017 - link
This is an amazing amount of benchmarking with many options. thank you. Must have been a lot of work :-)The obvious idea is this:
Gaming (modern CPU limited and most played games) & Productive work (rendering, encoding, 4K video work, R/statistics/Matlab)
Test those under 4c/8t and 8c/16t CPUs both from AMD and Intel - all at most common non-esoteric overlock levels (+/-10%).
This is what many of your readers want:
How much does c. 5Ghz 4c/8t do vs 4.x Ghz 8c/16t when taken to it's everyday stable extreme, in modern games / productivity.
The web is already full of benchmarks at stock speed. Or overclocked Ryzen R 7 against stock Intel, or OC intel against overclocked Ryzen - and the game/app selections are not very varied.
The result is a simple graph that plots the (assumed) linear trend in performance/price and shows any deviations below/above the linear trend.
Of course, if you already have the Coffee lake 6c/12t sample, just skip the 4c/8t and go with 6c/12t vs 8c/16 comparision.
Thanks for all the hard work throughout all these years!
Ryan Smith - Monday, July 24, 2017 - link
"so many interesting things to report about and they spend time on a niche product....."What can we say? CPUs have been our favorite subject for the last 20 years.=)
user_5447 - Monday, July 24, 2017 - link
"For 2017, Intel is steering the ship in a slightly different direction, and launching the latest microarchitecture on the HEDT platform."Skylake-S, Kaby Lake-S and Kaby Lake-X share the same microarchitecture, right?
Then Skylake-X is newer microarchitecture than Kaby Lake-X (changes to L2 and L3 caches, AVX-512).
Ian Cutress - Monday, July 24, 2017 - link
Correct me if I'm wrong: SKL-SP cores are derived from SKL-S, and 14nm. KBL-S/X are 14+, and shares most of its design with SKL-S, and the main changes are power related. Underneath there's no real performance (except Speed Shift v2), but Intel classifies Kaby Lake as its latest non-AVX512 IPC microarchitecture.user_5447 - Monday, July 24, 2017 - link
Kaby Lake-S has some errata fixes compared to Skylake-S. AFAIK, this is the only change to the CPU core (besides the Speed Shift v2, if it even involved hardware changes).David Kanter says Skylake-X/EP is 14+ nm http://www.realworldtech.com/forum/?threadid=16889...
extide - Wednesday, July 26, 2017 - link
I have a buddy who works in the fabs -- SKL-X is still on plain 14nm