The Intel Kaby Lake-X i7 7740X and i5 7640X Review: The New Single-Threaded Champion, OC to 5GHz
by Ian Cutress on July 24, 2017 8:30 AM EST- Posted in
- CPUs
- Intel
- Kaby Lake
- X299
- Basin Falls
- Kaby Lake-X
- i7-7740X
- i5-7640X
Benchmarking Performance: CPU Legacy Tests
Our legacy tests represent benchmarks that were once at the height of their time. Some of these are industry standard synthetics, and we have data going back over 10 years. All of the data here has been rerun on Windows 10, and we plan to go back several generations of components to see how performance has evolved.
All of our benchmark results can also be found in our benchmark engine, Bench.
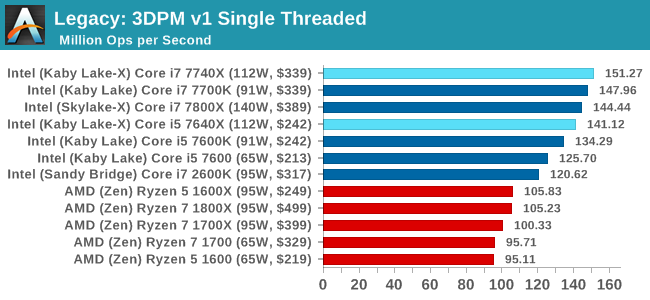
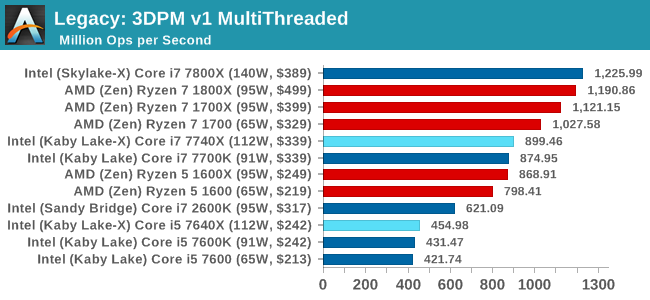
3D Particle Movement v1
3DPM is a self-penned benchmark, taking basic 3D movement algorithms used in Brownian Motion simulations and testing them for speed. High floating point performance, MHz and IPC wins in the single thread version, whereas the multithread version has to handle the threads and loves more cores. This is the original version, written in the style of a typical non-computer science student coding up an algorithm for their theoretical problem, and comes without any non-obvious optimizations not already performed by the compiler, such as false sharing.
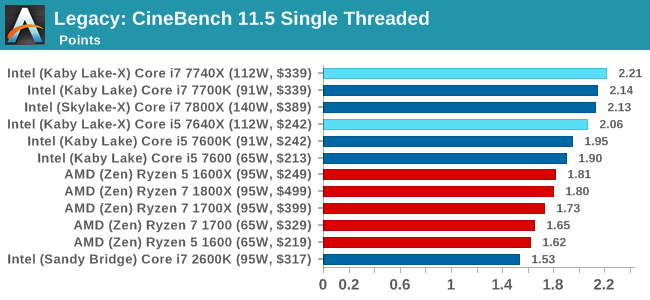
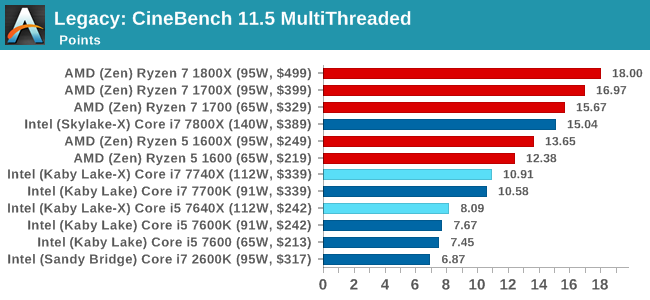
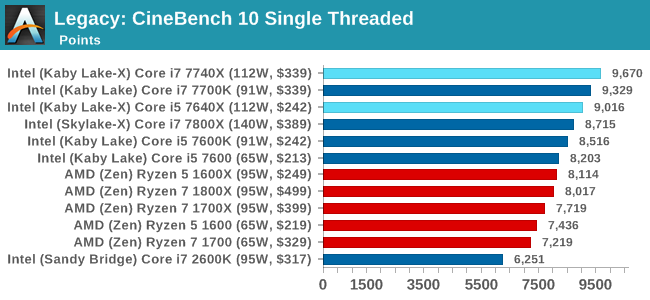
CineBench 11.5 and 10
Cinebench is a widely known benchmarking tool for measuring performance relative to MAXON's animation software Cinema 4D. Cinebench has been optimized over a decade and focuses on purely CPU horsepower, meaning if there is a discrepancy in pure throughput characteristics, Cinebench is likely to show that discrepancy. Arguably other software doesn't make use of all the tools available, so the real world relevance might purely be academic, but given our large database of data for Cinebench it seems difficult to ignore a small five-minute test. We run the modern version 15 in this test, as well as the older 11.5 and 10 due to our back data.
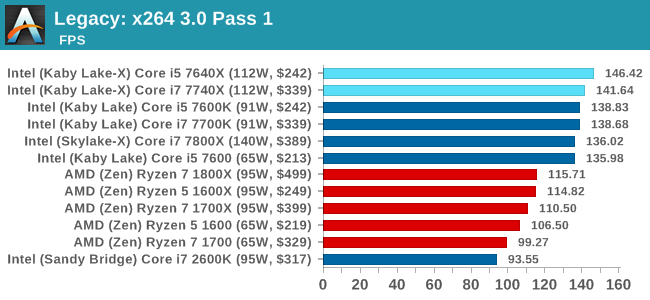
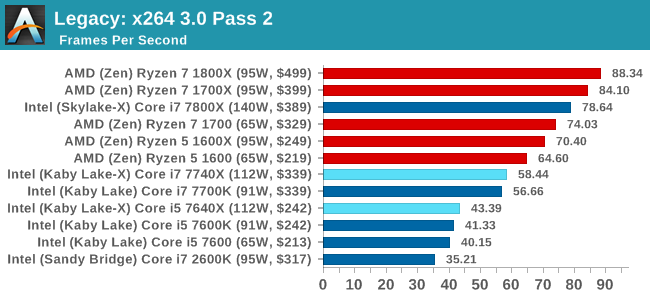
x264 HD 3.0
Similarly, the x264 HD 3.0 package we use here is also kept for historic regressional data. The latest version is 5.0.1, and encodes a 1080p video clip into a high-quality x264 file. Version 3.0 only performs the same test on a 720p file, and in most circumstances the software performance hits its limit on high-end processors, but still works well for mainstream and low-end. Also, this version only takes a few minutes, whereas the latest can take over 90 minutes to run.


176 Comments
View All Comments
mapesdhs - Monday, July 24, 2017 - link
2700K, +1.5GHz every time.shabby - Monday, July 24, 2017 - link
So much for upgrading from a kbl-x to skl-x when the motherboard could fry the cpu, nice going intel.Nashiii - Monday, July 24, 2017 - link
Nice article Ian. What I will say is I am a little confused around this comment:"Intel wins for the IO and chipset, offering 24 PCIe 3.0 lanes for USB 3.1/SATA/Ethernet/storage, while AMD is limited on that front, having 8 PCIe 2.0 from the chipset."
You forgot to mention the AMD total PCI-E IO. It has 24 PCI-E 3.0 lanes with 4xPCI-e 3.0 going to the chipset which can be set to 8x PCI-E 2.0 if 5Gbps is enough per lane, i.e in the case of USB3.0.
I have read that Kabylake-X only has 16 PCI-E 3.0 lanes native. Not sure about PCH support though...
KAlmquist - Monday, July 24, 2017 - link
With Kabylake-X, the only I/O that doesn't go through the chipset is the 16 PCI-E 3.0 lanes you mention. With Ryzen, in addition to what is provided by the chipset, the CPU provides1) Four USB 3.1 connections
2) Two SATA connections
3) 18 PCI-E 3.0 lanes, or 20 lanes if you don't use the SATA connections
So if you just look at the CPU, Ryzen has more connectivity than Kabylake-X, but the X299 chip set used with Kabylake-X is much more capable (and expensive) than anything in the AMD lineup. Also, the X299 doesn't provide any USB 3.1 ports (or more precisely, 10 gb per second speed ports), so those are typically provided by a separate chip, adding to the cost of X299 motherboards.
Allan_Hundeboll - Monday, July 24, 2017 - link
Interesting review with great benchmarks. (I don't understand why so many reviews only report average frames pr. second)The ryzen r5 1600 seems to offer great value for money, but i'm a bit puzzled why the slowest clocked R5 beats the higher clocked R7 in a lot of the 99% benchmarks, Im guessing its because the latency delta when moving data from one core to another penalize the higher core count R7 more?
BenSkywalker - Monday, July 24, 2017 - link
The gaming benchmarks are, uhm..... pretty useless.Third tier graphics cards as a starting point, why bother?
Seems like an awful lot of wasted time. As a note you may want to consider- when testing a new graphics card you get the fastest CPU you can so we can see what the card is capable of, when testing a new CPU you get the fastest GPU you can so we can see what the CPU is capable of. The way the benches are constructed, pretty useless for those of us that want to know gaming performance.
Tetsuo1221 - Monday, July 24, 2017 - link
Benchmarking at 1080p... enough said.. Completely and utterly redundantQasar - Tuesday, July 25, 2017 - link
why is benchmarking @ 1080p Completely and utterly redundant ?????meacupla - Tuesday, July 25, 2017 - link
I don't know that guy's particulars, but, to me, using X299 to game at 1080p seems like a waste.If I was going to throw down that kind of money, I would want to game at 1440p or 4K
silverblue - Tuesday, July 25, 2017 - link
Yes, but 1080p shifts the bottleneck towards the CPU.