The SanDisk X400 1TB SSD Review
by Billy Tallis on May 6, 2016 9:00 AM ESTATTO
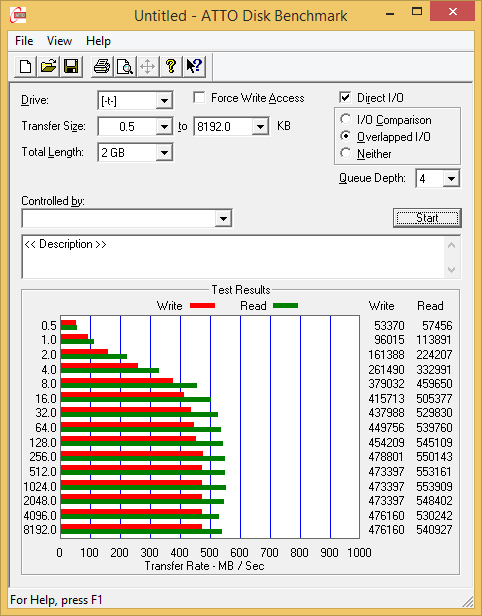
ATTO's Disk Benchmark is a quick and easy freeware tool to measure drive performance across various transfer sizes.
 |
|||||||||
Aside from the write speeds that lag behind read speeds by a larger than normal margin, the ATTO results are reasonable and do not show signs of any major problems.
AS-SSD
AS-SSD is another quick and free benchmark tool. It uses incompressible data for all of its tests, making it an easy way to keep an eye on which drives are relying on transparent data compression. The short duration of the test makes it a decent indicator of peak drive performance.
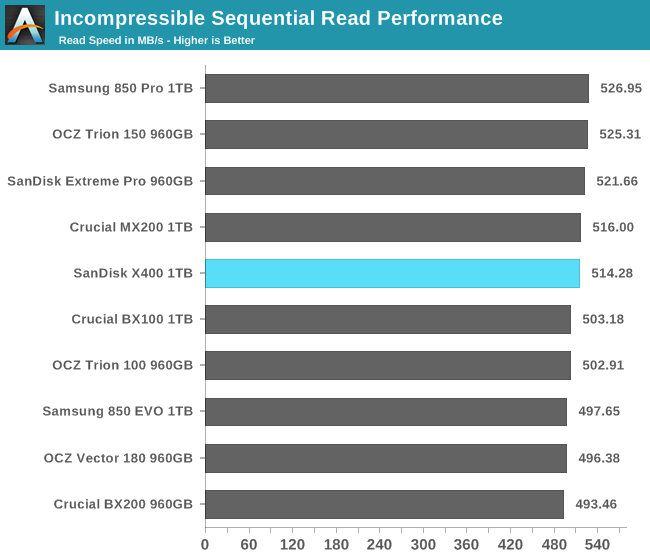
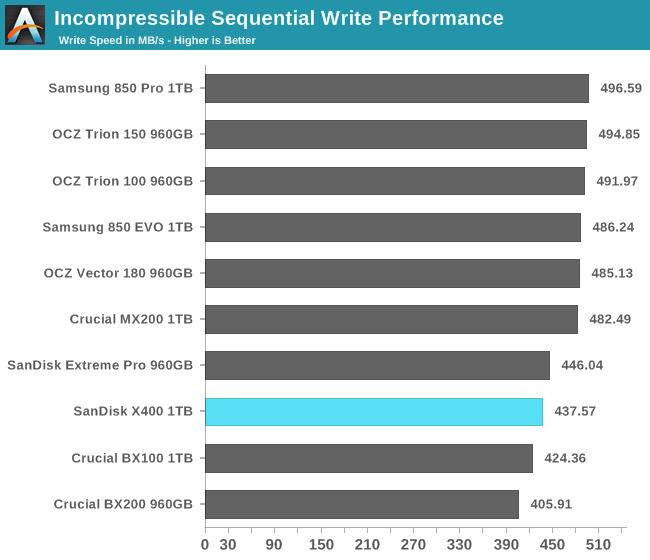
None of these drives show any meaningful difference in AS-SSD sequential read speed, but the write speed limitations of the X400 do show up clearly on this test.
Idle Power Consumption
Since the ATSB tests based on real-world usage cut idle times short to 25ms, their power consumption scores paint an inaccurate picture of the relative suitability of drives for mobile use. During real-world client use, a solid state drive will spend far more time idle than actively processing commands. Our testbed doesn't support the deepest DevSlp power saving mode that SATA drives can implement, but we can measure the power usage in the intermediate slumber state where both the host and device ends of the SATA link enter a low-power state and the drive is free to engage its internal power savings measures.
We also report the drive's idle power consumption while the SATA link is active and not in any power saving state. Drives are required to be able to wake from the slumber state in under 10 milliseconds, but that still leaves plenty of room for them to add latency to a burst of I/O. Because of this, many desktops default to either not using SATA Aggressive Link Power Management (ALPM) at all or to only enable it partially without making use of the device-initiated power management (DIPM) capability. Additionally, SATA Hot-Swap is incompatible with the use of DIPM, so our SSD testbed usually has DIPM turned off during performance testing.
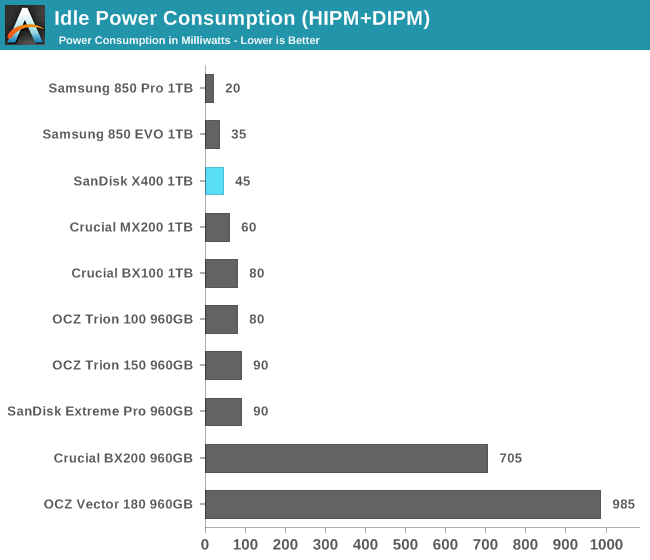
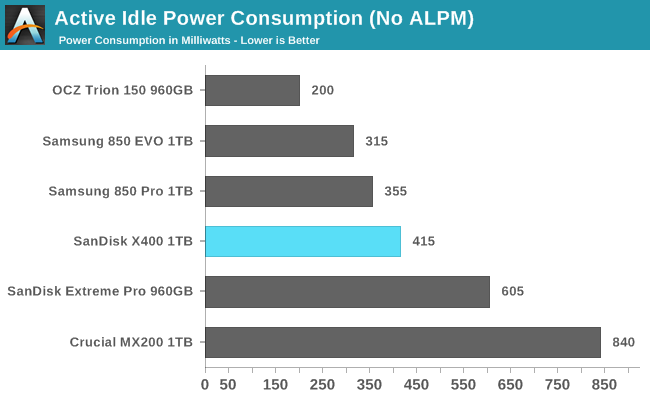
Slumber power drawn by the X400 is not quite the lowest but is still pretty good, but active idle power is twice as high as the OCZ Trion 150 based on the Toshiba TC58/Phison S10 controller platform.


41 Comments
View All Comments
Michael Bay - Saturday, May 7, 2016 - link
There`s 3.1 down there somewhere too.I`d like to have the source on your percentages though.
Madpacket - Wednesday, May 11, 2016 - link
Looks like the 1TB Mushkin Reactor (MKNSSDRE1TB) is still the best value drive to beat. Nice to see TLC drives other than Evo's getting better though.hojnikb - Thursday, June 23, 2016 - link
there is also reactor LT, if you want 512GB.justkar4u - Wednesday, May 11, 2016 - link
@anandtech : Seriously ? You are trying to compare apples to oranges to grapes. You are comparing 3D NAND products with 2D NAND, MLC with TLC type products. Sandisk X400 should be compared with OCZ Trion and Crucial BX series. As you can see X400 is better than Crucial MX in some cases ! Samsung, OCZ vector, crucial MX should not even be there in comparison. With that said, clearly X400 is the winner in TLC segment.nobozos - Thursday, May 12, 2016 - link
It would sure be nice if you could include a graph in some (all?) of your charts that normalizes for cost. Raw performance is nice, but performance/$ is also very useful.Andre74 - Friday, May 27, 2016 - link
What's the deal with referring to "Power" both as W·h, and as W (but commenting on efficiency)?Efficiency would be energy consumed per byte read, for example. Effectiveness could be bytes read per second. Measuring power usage during operation tells you nothing of either efficiency or effectiveness, unless it's calculated as total energy.
BimmerInd - Wednesday, June 1, 2016 - link
"The Reactor is about $25 cheaper but only has a 3-year warranty and less than half the write endurance rating." Is this because of n-cache technique? MLC, TLC factors - Does it not make Mushkin a little better one?Endurance Rating
Mushkin Enhanced Reactor 1TB - 144TB
SanDisk X400 1TB - 320TB
Moreover SanDisk X400 is recommended for OEM unlike Mushkin which is targeted at consumer? Does it make a difference?
hojnikb - Thursday, June 23, 2016 - link
Thats just manufacturer rating. I'm sure unless Mushkin uses the crappiest MLC out there, that it will outlive sandisk x400 in terms of real world endurance.BimmerInd - Friday, June 24, 2016 - link
It says it uses Micron's NAND same as in Crucial's BX100. So which one should I choose?runasroot - Thursday, January 12, 2017 - link
I have a question: I know it states that it is 1024gb but is it a true 1024 or is it like something 960gb? I'm cloning a desktop with clonezilla and I need a 1tb ssd that is larger that 960GB to clone from disk to disk. <a href="https://wander.io">Wander</a>