The Intel Xeon E5 v4 Review: Testing Broadwell-EP With Demanding Server Workloads
by Johan De Gelas on March 31, 2016 12:30 PM EST- Posted in
- CPUs
- Intel
- Xeon
- Enterprise
- Enterprise CPUs
- Broadwell
Spark Benchmarking
Spark is wonderful framework, but you need some decent input data and some good coding skills to really test it. Speeding up Big Data applications is the top priority project at the lab I work for (Sizing Servers Lab of the University College of West-Flanders), so I was able to turn to the coding skills of Wannes De Smet to produce a benchmark that uses many of the Spark features and is based upon real world usage.

The test is described in the graph above. We first start with 300 GB of compressed data gathered from the CommonCrawl. These compressed files are a large amount of web archives. We decompress the data on the fly to avoid a long wait that is mostly storage related. We then extract the meaningful text data out of the archives by using the Java library "BoilerPipe". Using the Stanford CoreNLP Natural Language Processing Toolkit, we extract entities ("words that mean something") out of the text, and then count which URLs have the highest occurrence of these entities. The Alternating Least Square algorithm is then used to recommend which URLs are the most interesting for a certain subject.
We tested with Apache Spark 1.5 in standalone mode (non-clustered) as it took us a long time to make sure that the results were repetitive.
Here are the results:
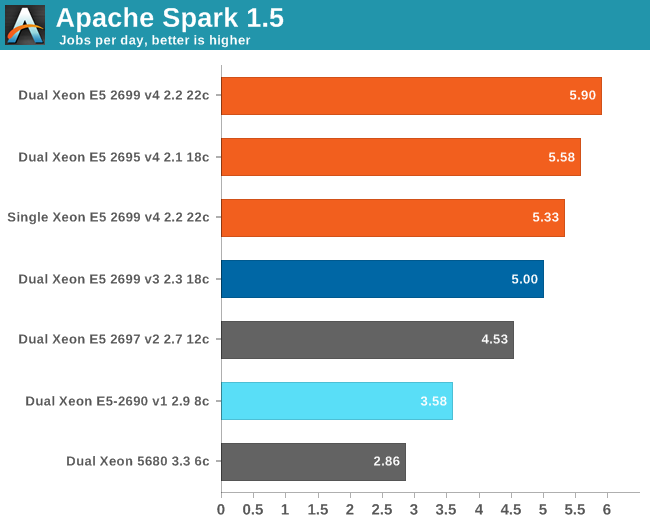
Spark threw us back into nineties, to the time that several workloads still took ages on high-end computers. It takes no less than six and half hours on a 16-core Xeon E5-2690 running at 2.9 GHz to crunch through 300 GB of web data and extract anything meaningful out of it. So we have to express our times in "jobs per day" instead of the usual "jobs per hour". Another data point: a Xeon D-1540 (8 Broadwell cores at 2.6 GHz) needs no less than 11 hours to do the same thing. Using DDR4 at 2400 MHz instead of 1600 MHz gives a boost of around 5 to 8%.
About 10% of the time is spent on splitting up the workload in slices, 30% of the time is spent in language processing, and 50% of the time is spent on aggregating and counting. Only 3% is spent waiting on disk I/O, which is pretty amazing as we handle 300 GB of data and perform up to 55 GB of (Shuffle) writes. The ALS phase scales badly, but takes only 3 to 5% of the time. But there is no escaping on Amdahl's law: throwing more cores gives diminishing returns. Meanwhile the use of remote memory seriously slows processing down: the dual Xeon increases performance only by 11% compared to the single CPU. Broadwell does well here: a Broadwell core at 2.2 GHz is 12% faster than a Haswell at 2.3 GHz.
We are still just starting to understand what really makes Spark fly and version 1.6 might still change quite a bit. But it is clear that this is one of the workloads that will make top SKUs popular: a real killer app for the most potent CPUs. You can replace a dual Xeon 5680 with one Xeon E5-2699 v4 and almost double your performance while halving the CPU power consumption.


112 Comments
View All Comments
SkipPerk - Friday, April 8, 2016 - link
"Anyone putting Microsoft on bare hardware these days is nuts"This brother is speakin the truth!
warreo - Thursday, March 31, 2016 - link
Can someone clarify this line for me?"The average performance increase versus the Xeon E5-2690 is 3%, and the Broadwell cores get a boost of no less than 19%."
Does that mean IPC increase is 19% for Broadwell, offset by ~16% decline in clockspeed to get to 3% average performance increase? But that doesn't make sense to me as a 3.8ghz (E5-2690) to 3.6ghz (E5-2699 v4) is only 5% decline in max clockspeed?
ShieTar - Thursday, March 31, 2016 - link
I understood it as "the -Ofast setting boosts Broadwell by 19%", so with the -O2 setting it was actually 16% slower than the 2690.And I think the AT-Theory based on the original measurements is that the 3.6GHz boost are not even held for a significant amount of time, so that Broadwell in reality comes with an even worse decline in clock speed.
warreo - Thursday, March 31, 2016 - link
Your interpretation makes much more sense than mine, but still doesn't quite add up. The improvement from using -Ofast vs. -O2 is 13% on average, and the lowest improvement is 4% on the xalancbmk, well below the "no less than 19%" quoted by Johan.Perhaps the rest of the disparity is normalizing for sustained clock speeds as you suspect? Johan is that correct?
Ryan Smith - Thursday, March 31, 2016 - link
I've reworded that passage to make it clearer. But ShieTar's interpretation was basically correct."Switching from -O2 to -Ofast improves Broadwell-EP's absolute performance by over 19%. Meanwhile the relative performance advantage versus the Xeon E5-2690 averages 3%. "
JohanAnandtech - Thursday, March 31, 2016 - link
That means that the -ofast has much more effect on the Broadwell. I mean by that that -ofast is 19% faster than -o2 on Broadwell, while it is 3% faster on Sandy Bridge. I assume that the older the architecture, the better the compiler is able to optimize it without special tricks.warreo - Friday, April 1, 2016 - link
Thanks for the clarification. Loved the review, great work Johan!Pinn - Thursday, March 31, 2016 - link
I'm still happy I went with the 6 core x99 over the 8 core. Massive core count is nice to see available, but I don't see the true value. Looks like you have to do the same rough math to see if the clock speed reduction is worth the core count.Oxford Guy - Tuesday, April 5, 2016 - link
Why would there be "true value" for six and not for eight?Pinn - Wednesday, April 6, 2016 - link
Single threaded workloads.