64GB SSD on the Desktop: Samsung and OCZ go mainstream
by Gary Key on May 15, 2008 11:30 PM EST- Posted in
- Storage
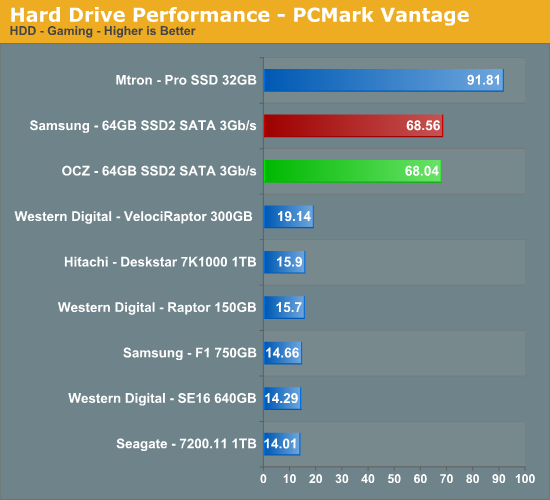
PCMark Vantage
PCMark Vantage is the latest system benchmark available from Futuremark, and is only for use on Windows Vista. Similar to the venerable PCMark05 in its makeup, Vantage modernizes the criteria and test methodology to reflect what users may encounter when running the new Windows OS and current applications. For the HD test suite, the white paper breaks the tests down as:
- Windows Defender:
Windows Defender performs a scan operation, resulting in a read-intensive
(99.5% read, 0.5% write) benchmark reflecting a common task in Windows Vista.
- Gaming Performance:
Streaming performance is measured using actual game mechanics found in Alan
Wake. This test is nearly all read (99.95% read, 0.05% write) in nature.
- Windows Photo
Gallery: A large collection of images is imported into Windows
Photo Gallery. This is the first of the tests which bring write performance
into account in a meaningful way, with a roughly 84% read, 16% write ratio.
- Windows Vista
Startup: Simulates Windows Vista start-up operations,
producing a test that breaks down to roughly 85% read and 15% write operations.
- Windows Movie Maker:
The first of the Vantage tests which comes close to equally dividing read and
write operations (54% read, 46% write), concurrent video performance is tested
both for video read and skip performance, as well as video write operations.
- Windows Media Center:
Performing three distinct tasks:
- SDTV video playback
- SDTV video streaming to Extender for Windows Media Center
- SDTV video recording
- SDTV video playback
- Windows Media Player:
Adds music to Windows Media Player. This test reverts to favoring read
operations (78% read, 22% write).
- Application Loading:
The following applications are loaded:
- Microsoft Word 2007
- Adobe Photoshop CS2
- Internet Explorer 7
- Outlook 2007
- Microsoft Word 2007
The total benchmark is roughly 87% reads and 13% writes in nature. We run each test five times per drive, producing a median score that we use for comparison in our charts.


One advantage that SSD technology holds over mechanical drives is in access times that typically range from 0.1ms~0.3ms compared to 7.0ms~13ms on average for current mechanical drives. That alone almost ensures total dominance in benchmarks based on Intel's IPEAK program that looks at the pure speed of the drive or controller tested.


38 Comments
View All Comments
ameatypie - Saturday, January 24, 2009 - link
i think in one years time, these are going to be the default laptop hard drives. The price of flash memory is going down so fast..... a year ago, a 4GB flash drive was &70 USD or more.... now you can get em for $5. If that sort of trend continues, we are going to have super-quick laptops in no time at all.....Zak - Monday, May 19, 2008 - link
I remember couple of years ago they were promising huge speed improvement and energy savings but when SSD finally hit the store shelves they're quite underwhelming considering the price. What's most disappointing is almost no improvement in battery life on laptops! At least that's the case with Air. Still, this is new tech so I hope things will get better in the next couple of years, so I'm not writing SSD off yet.Z.
FXi - Monday, May 19, 2008 - link
Would have been helpful if just one fast laptop drive had been included in the mix to see for that segment of users what degree of speedup is gained.I figure you'll get to it in time. These kinds of reviews are far from over :)
MadBoris - Saturday, May 17, 2008 - link
This is solid state?I don't understand how people can look at this as anything but a good tech demo.
Comparing actual physical RAM to a Hard drive is night and day and yet somehow a solid state drive can barely compete or even falls short of a hard drive at times.
Isn't the point of solid state that we all desired for decades the huge performance gains???
Their is something really wrong with this picture when it still can't compete with a hard drive yet costs 4 times as much.
Give me a quality RAM Drive on an OS any day, address the volatility of the RAM or load the ram drive on startup of the computer, using the HD as a cache during startup and shutdown just like sleep does.
Until solid state will improve performance over a hard drive by 2-3 times then it is just a tech demo. I would be happy to have something much smaller and yet much faster memory for installing some programs on, specifically an OS and some main applications, not data.
The good thing is their is great opportunity for competition and advancement in this market. Wake me up when we get there.
Nice article although I disagree it is award worthy as a technology regardless how much improvement took place, their is a galaxy of room left for improvement for it to be worthy of consideration above .01% of consumers.
Harkonnen - Saturday, May 17, 2008 - link
I would love to see Anandtech test out this SSD.http://www.tomshardware.com/reviews/ssd-memoright,...">http://www.tomshardware.com/reviews/ssd-memoright,...
codeThug - Friday, May 16, 2008 - link
About as mainstream as Bigfoot Networks $249.99 Killer NIC M1http://www.newegg.com/product/product.aspx?Item=N8...">http://www.newegg.com/product/product.aspx?Item=N8...
TheriusDrake - Friday, May 16, 2008 - link
I'd love to see the game load times on the fastest Core2 Duo on an Intel and Nivida Mobo to see if there are any major differences in those benchmarks.shabby - Friday, May 16, 2008 - link
Who would spend that much money only to receive 1 year of warranty on the ocz ssd?Arbie - Friday, May 16, 2008 - link
Do the vendors quote these? Are there any verifications / experience? Not one SSD review I've seen has even raised this issue.Of course any drive can fail at any time (random), and all mechanical drives will eventually wear out too. What I'm talking about is unexpectedly near-term, statistically-predictable wearout.
Arbie
chizow - Friday, May 16, 2008 - link
Given the storage demands of the latest HD media and PC games, I just don't see how SSD will overcome standard HDD any time soon. I can see them surpassing HDD in speed, but not both speed with increased storage capacity. And that's before considering pricing. I have a hard time justifying even the $1/GB VelociRaptor nowadays given the price to performance of the larger drives, and that's coming from someone who owns two 150GB Raptors.I think SSD has a much better future serving the performance sector in that gap between DRAM and conventional HDD storage. I'd like to see them get closer to DRAM speed, keeping capacity lower, but perhaps implementing something like integrated RAID to speed things up. As more people move towards 64-bit OS and multimedia apps and games continue to grow, 8GB of RAM may not be enough in the not too distant future. Games are already spilling onto multiple DVDs with install folders easily surpassing 10GB for a single game after patches and expansions.
This may pose a problem for board and dimm makers, as it seems increasing memory capacity is a limitation that can't easily be overcome. Current solutions are limited to 4GB per dimm I believe and server boards with additional dimm slots or daughter cards. Mainstream solutions would be reluctant to adopt these changes as they'd increase cost/size significantly. Introducing a fast, hybrid SSD solution could help bridge the gap between system RAM and HDD storage giving programs faster performance as needed.