Seagate Barracuda 7200.10 750GB: Size Does Matter
by Gary Key on May 18, 2006 9:00 AM EST- Posted in
- Storage
IPEAK Game Installation Tests
Our IPEAK based Game Installation benchmarks simply show the ability of the hard drive to write data as quickly as possible to the disk based upon the installation software instructions. As detailed in our IPEAK setup description, we installed the games from our source drive in order to eliminate the optical drive bottleneck. In separate application timing we witnessed basically the same percentage spread when installing the games via our DVD drive so these results are representative of actual installation performance.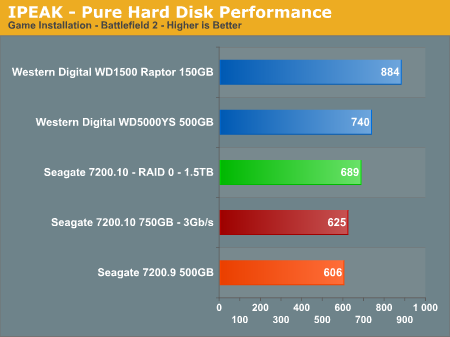
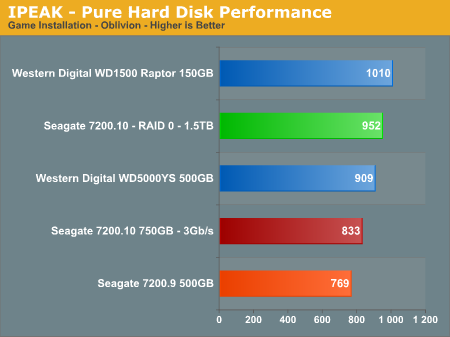
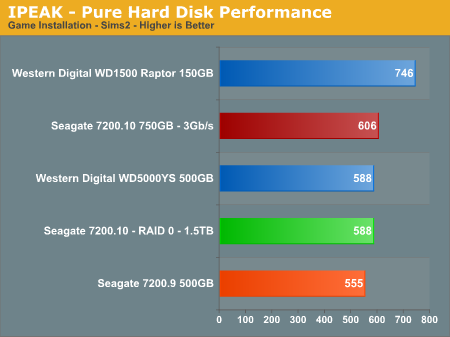
We see both WD drives performing very well in these benchmarks, with the speed of the WD Raptor along with its impressive and sustainable transfer rates simply dominating the other drives in these tests. The write performance of the Seagate 7200.10 is very good in the Sims 2 benchmark as the disk utilization numbers are very consistent along with a close grouping of block sizes. The drive seems to thrive on consistent read/write requests for medium to large size blocks of information with seek distances that are close to zero.
The performance of the Seagate 7200.10 trails off in the Oblivion and Battlefield 2 benchmarks as the disk utilization numbers begin to vary along with seek distances that are no longer clustered together. Considering the platter density used in this drive, if the requests do not involve data residing on the same track, then the cache buffer will probably not be able to satisfy the request resulting in a bottleneck effect due to track-to-track seeks or poor rotational latencies. The effects of RAID 0 in these tests are minimal with performance actually suffering during our Sims 2 load test, which is a more representative result with RAID 0 in actual application usage.
IPEAK Game Play Tests
The IPEAK based Game Play tests are centered on the benefits of having a hard disk that can load non-linear and/or sequential data files quickly without interrupting the flow of the game. While the benchmark numbers indicate the performance ability of the drives within the game, these numbers will not correlate into an increase in frame rates, only an improvement in level load times, game initiation, and general responsiveness of the storage system.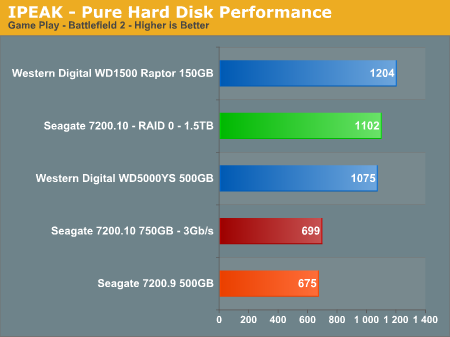

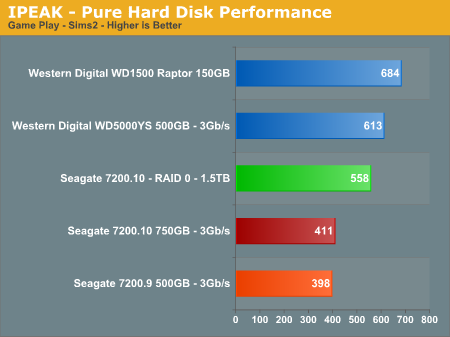
The Seagate drives struggle in these benchmarks compared to the Western Digital offerings. However, we did not notice any slowdowns or stuttering during actual game play or playback of our trace recordings to analyze the drive's performance. The Seagate 7200.10 outperforms the 7200.9 by 3% in Sims 2, 5% in Oblivion, and 4% in Battlefield 2. The RAID 0 performance in Battlefield 2 was impressive from an I/O perspective while during actual game testing the load time was improved by 7%. The RAID 0 performance in our other two games showed the typical increase in I/O performance but in actual game play it was not noticeable. The WD Raptor continues it dominance against other drives in the gaming benchmarks but the WD RE2 500GB makes a strong case as high capacity gaming drive.
After an analysis of our trace files we recognized a familiar pattern with the Seagate 7200.10 as the seek distances were not clustered together resulting in the inability of the drive to keep the requests cached resulting in a bottleneck effect during track to track seeks and the resulting rotational latency. This issue compounds itself on drives with multiple high density platters. Until we are able to review the smaller capacity drives in the 7200.10 series it will be difficult to determine if the drive requires additional firmware tuning for increasingly complex localized data access patterns, improved caching algorithms, or an increase in cache size to compensate for the 41% increase in platter density.


44 Comments
View All Comments
JakeBlade - Friday, May 26, 2006 - link
Interesting that this drive has a MADE IN SINGAPORE label instead of Seagate's usual MADE IN CHINA junk.ElFenix - Friday, May 19, 2006 - link
no reason to upgrade from my SE16, i see.i'd like to see a couple more drives in tests, such as the latest hitachi.
Gary Key - Friday, May 19, 2006 - link
The reason we did not include the Hitachi unit is we have the revised 500GB unit arriving shortly and as mentioned in the article we will have a complete 500GB roundup with the new 7200.10 also. It will take some time to build the database with the revised test suite as we also have additional application timer tests coming shortly.
The performance across most of the recently released mainstream drives is so close now that it comes down to a personal decision on warranty, reliability, thermals/acoustics, and capacity for the most part. However, drives like the Raptor and RE2 series do make things interesting for SATA on the desktop as did this drive for a PVR fanatic. ;-)
ElFenix - Friday, May 19, 2006 - link
i'd also like to see audio tests from a little bit further away. 5 mm doesn't give a realistic idea of how loud it will be sitting 3 feet away on the floor. plus, for all i know where you place the microphone is extremely important when at 5 mm.Gary Key - Friday, May 19, 2006 - link
There is no one good area to measure the acoustics as you never know where the PC will be located, what type of case, fan noise, or ambient sounds are present. I can tell you that a drive that is loud at 3mm~5mm will be loud at three feet with all things being equal. Sound tones are also very subjective, the dull thumping sound the drive has under load might be perfectly acceptable while the higher pitched clicking sound of a Maxtor will be unbearable for some people.
We place the two mics at different points on the drive to ensure a consistent recording point, we assume most people will utilize a horizontal mounting point with the rear of the drive facing the case front, although we test the drive facing the case side also as this cage design is becoming very popular. The tone of the drive can change dramatically with the addition of rubber washers between the drive and the mount points.
Thanks for the comments. :)
jhvtoor - Friday, May 19, 2006 - link
Temperature measurement using S.M.A.R.T. is not reliable. The sensor and electronics on the harddrive are used, en they are not calibrated.
I am using the freeware "HDD Health" utility to monitor the SMART information. It reported the drive temperature of my desktop is 12 degrees celcius immediatly after winXP boot, while the room temperature is 19 degrees.... I am not using cooling techniques on this drive. This can only be explained by an inaccurate temperature measurement of this drive.
I would suggest to use one an independent measurement instument in the future. Attach the sensor in the middle of the cover plate.
Gary Key - Friday, May 19, 2006 - link
Hi,1. We have found S.M.A.R.T. to be "fairly" accurate along with our capture utility. We know it is not perfect but it allows us a consistent measurement of each drive in testing. In our 7200.10 test ActiveSmart reported a temperature of 26c after boot, room temp was 22c. We put the drive through 15 minutes of light usage, let it idle for 15 minutes, and then report this number as our idle number. All of the drives we have tested have followed the same pattern with a consistent idle reading after this usage, the idle temp will be the same 15 or 30 minutes later. If you stress the drive, you will see the temps rise accordingly and then fall back to the standing idle temp during the cooldown phase.
2. One drawback is the temperatures are not "real" time, there is a delay built in, this is why on the load test (also idle) we loop PCMark05 several times and then take the reported temperature at the end of the session, generally the high temperature was actually reached in the previous loop.
3. We have have tried using a sensor, infrared, and other methods with varying results. The problem is each section of the drive will report a different number. When we utilized a sensor on the top plate, the temps varied from drive to drive with the same model being tested. Each supplier uses different materials for their casings so that creates greater variables, it just is not consistent enough to report.
toattett - Thursday, May 18, 2006 - link
Apparently,If I want a speedy drive, I buy the raptor.
If I want a super large drive, I buy the new 750GB Seagate.
If I want good performance and good amount of stoarge, I buy the 500GB WD.
Missing Ghost - Thursday, May 18, 2006 - link
The pictures for the noise level are wrong. You put the dbA level as if it was a linear scale. It's not that way, the space between 0dB and 10dB should be smaller than the space between 10dB and 20dB. That way it will show more clearly the difference between the noise levels. It's a logarithmic scale.Gary Key - Thursday, May 18, 2006 - link
Our current graph engine will not allow us to do this type of scale manipulation. We will probably have to utilize a Microsoft Excel chart in the next article. We agree with you, just not possible with the internal engine at this time although we are working on a new one.