GIGABYTE Z97X-UD5H Review: Choose Your Storage Option
by Ian Cutress on May 14, 2014 9:00 AM EST- Posted in
- Motherboards
- Intel
- Gigabyte
- Z97
Many thanks to...
We must thank the following companies for kindly providing hardware for our test bed:
Thank you to OCZ for providing us with PSUs and SSDs.
Thank you to G.Skill for providing us with memory kits.
Thank you to Corsair for providing us with a PSU, a H80i CLC and DRAM.
Thank you to ASUS for providing us with the AMD HD7970 GPUs and some IO Testing kit.
Thank you to MSI for providing us with the NVIDIA GTX 770 Lightning GPUs.
Thank you to Rosewill for providing us with the PSUs and RK-9100 keyboards.
Thank you to ASRock for providing us with the 802.11ac wireless router for testing.
Test Setup
| Test Setup | |
| Processor |
Intel Core i7-4770K ES 4 Cores, 8 Threads, 3.5 GHz (3.9 GHz Turbo) |
| Motherboards | GIGABYTE Z97X-UD5H |
| Cooling |
Corsair H80i Thermalright TRUE Copper |
| Power Supply |
OCZ 1250W Gold ZX Series Corsair AX1200i Platinum PSU |
| Memory | G.Skill RipjawsZ 4x4 GB DDR3-1600 9-11-9 Kit |
| Memory Settings | 1600 9-11-9-27 1T tRFC 240 |
| Video Cards |
MSI GTX 770 Lightning 2GB (1150/1202 Boost) ASUS HD7970 3GB (Reference) |
| Video Drivers |
Catalyst 13.12 NVIDIA Drivers 335.23 |
| Hard Drive | OCZ Vertex 3 256GB |
| Optical Drive | LG GH22NS50 |
| Case | Open Test Bed |
| Operating System | Windows 7 64-bit SP1 |
| USB 2/3 Testing | OCZ Vertex 3 240GB with SATA->USB Adaptor |
Power Consumption
Power consumption was tested on the system as a whole with a wall meter connected to the OCZ 1250W power supply, while in a single MSI GTX 770 Lightning GPU configuration. This power supply is Gold rated, and as I am in the UK on a 230-240 V supply, leads to ~75% efficiency > 50W, and 90%+ efficiency at 250W, which is suitable for both idle and multi-GPU loading. This method of power reading allows us to compare the power management of the UEFI and the board to supply components with power under load, and includes typical PSU losses due to efficiency. These are the real world values that consumers may expect from a typical system (minus the monitor) using this motherboard.
While this method for power measurement may not be ideal, and you feel these numbers are not representative due to the high wattage power supply being used (we use the same PSU to remain consistent over a series of reviews, and the fact that some boards on our test bed get tested with three or four high powered GPUs), the important point to take away is the relationship between the numbers. These boards are all under the same conditions, and thus the differences between them should be easy to spot.
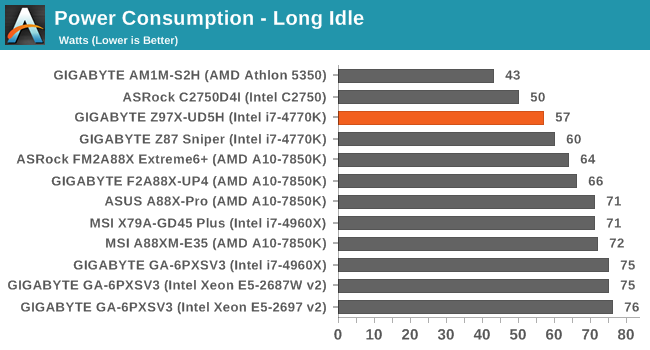
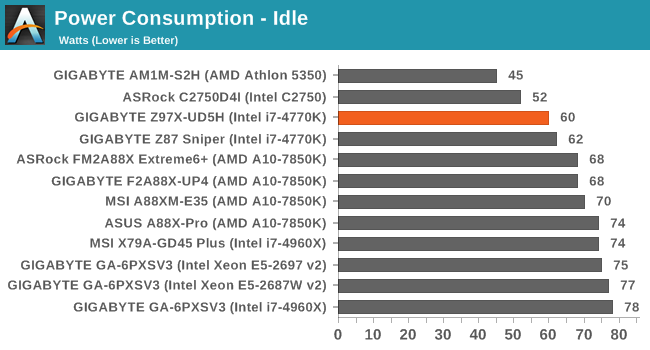
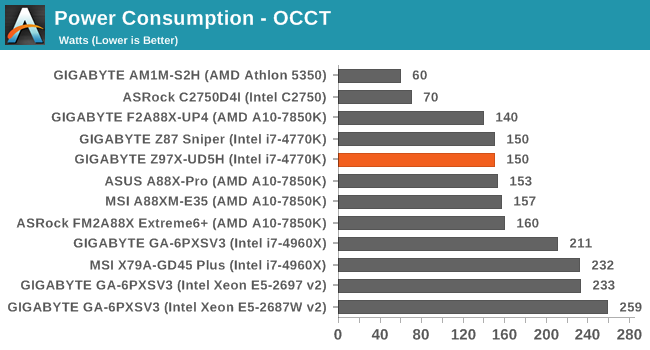
The UD5H beats the older Z87 Sniper for power consumption, and out of the Z97 boards we've tested so far it comes out better than most.
Windows 7 POST Time
Different motherboards have different POST sequences before an operating system is initialized. A lot of this is dependent on the board itself, and POST boot time is determined by the controllers on board (and the sequence of how those extras are organized). As part of our testing, we are now going to look at the POST Boot Time - this is the time from pressing the ON button on the computer to when Windows 7 starts loading. (We discount Windows loading as it is highly variable given Windows specific features.) These results are subject to human error, so please allow +/- 1 second in these results.
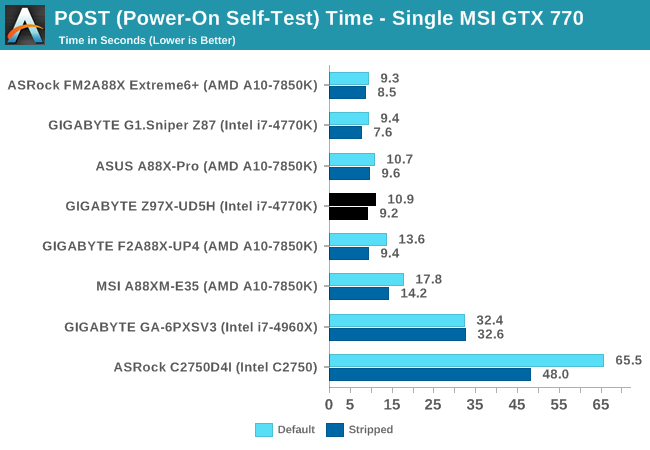
With Windows 8 having more market share, the impetus to improve POST times for Windows 7 systems might not be at the top of a manufacturers list. However the Z97X-UD5H puts in a good show under 11 seconds by default, and almost 9 seconds when stripped.


53 Comments
View All Comments
Marlowe - Wednesday, May 14, 2014 - link
Thank you. I wish there were M.2 benchmarks. Guess there are no drives out. Plextor M6e? Where are you and your friends?TelstarTOS - Thursday, May 15, 2014 - link
wrong, there are.basroil - Thursday, May 15, 2014 - link
M.2 PCIe drives worth testing don't yet exist, almost all are cheating (sata raid) or just not that great.TelstarTOS - Thursday, May 15, 2014 - link
There are two, the plextor is the lower performer, and ther Samsung XP941 that I linked above (but i'm not sure if the post was deleted - so i'm not posting a link here).TelstarTOS - Saturday, May 17, 2014 - link
Uhm it didn't take long for a review ;)XZerg - Wednesday, May 14, 2014 - link
hmmm... here i was hoping to see some storage benches but disappointment again. what's the point of calling the review "Choose Your Storage Option" when there is no storage review?kwrzesien - Wednesday, May 14, 2014 - link
Would it make sense to include the rear port cover in place for the picture? I'd like to see the finished effect, plus maybe it names which network port is Intel vs Killer.DanNeely - Wednesday, May 14, 2014 - link
Is the power consumption from the 900mhz underclocking option different from what's seen during the long idle test?DanNeely - Wednesday, May 14, 2014 - link
I really like that Gigabyte provided a block diagram of the board. Between flexible IO, PLX chips, on board USB hubs, and the sata switch used here; it can be really hard to figure out exactly what's connected where and what can be used at the same time. The diagram had almost everything I'd want to know collected in a single place; the only exception being which USB3 ports were attached to the hub.I really hope other motherboard vendors will provide similar information as well.
Ian Cutress - Wednesday, May 14, 2014 - link
GIGABYTE do this in all their motherboard manuals, so you only have to download the manual from the website and have a look. I am trying to get the other motherboard manufacturers to do this.