ASUS Rampage IV Black Edition Review
by Ian Cutress on January 5, 2014 10:00 AM EST- Posted in
- Motherboards
- Intel
- Asus
- X79
Readers of our motherboard review section will have noted the trend in modern motherboards to implement a form of MultiCore Enhancement / Acceleration / Turbo (read our report here) on their motherboards. This does several things – better benchmark results at stock settings (not entirely needed if overclocking is an end-user goal), at the expense of heat and temperature, but also gives in essence an automatic overclock which may be against what the user wants. Our testing methodology is ‘out-of-the-box’, with the latest public BIOS installed and XMP enabled, and thus subject to the whims of this feature. It is ultimately up to the motherboard manufacturer to take this risk – and manufacturers taking risks in the setup is something they do on every product (think C-state settings, USB priority, DPC Latency / monitoring priority, memory subtimings at JEDEC). Processor speed change is part of that risk which is clearly visible, and ultimately if no overclocking is planned, some motherboards will affect how fast that shiny new processor goes and can be an important factor in the purchase.
For reference, the ASUS Rampage IV Black Edition does enable MultiCore Enhancement when XMP is enabled.
Point Calculations - 3D Movement Algorithm Test
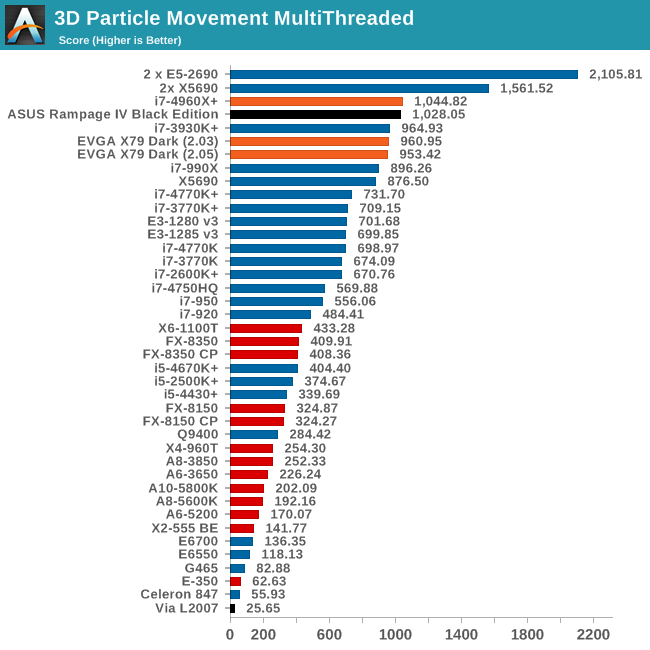
The algorithms in 3DPM employ both uniform random number generation or normal distribution random number generation, and vary in various amounts of trigonometric operations, conditional statements, generation and rejection, fused operations, etc. The benchmark runs through six algorithms for a specified number of particles and steps, and calculates the speed of each algorithm, then sums them all for a final score. This is an example of a real world situation that a computational scientist may find themselves in, rather than a pure synthetic benchmark. The benchmark is also parallel between particles simulated, and we test the single thread performance as well as the multi-threaded performance.
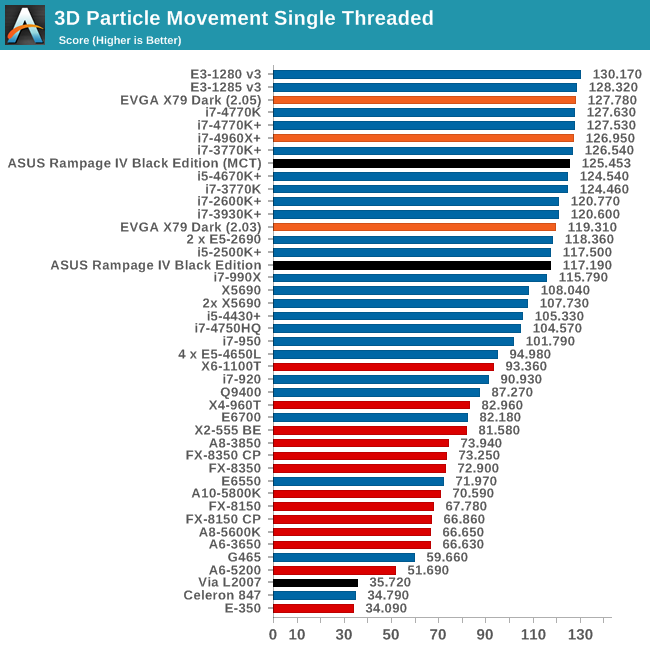
We had some issues with the single threaded test and the RIVBE – it would perform as if the CPU was stuck at 3.6 GHz (such as when MCE is turned off) even with MCE on. The benchmark did produce a high outlier at 125.4 points, which is more reasonable. I was unable to track down this issue, and it did not occur on any other benchmarks.
Compression - WinRAR 4.2
With 64-bit WinRAR, we compress the set of files used in the USB speed tests. WinRAR x64 3.93 attempts to use multithreading when possible, and provides as a good test for when a system has variable threaded load. WinRAR 4.2 does this a lot better! If a system has multiple speeds to invoke at different loading, the switching between those speeds will determine how well the system will do.
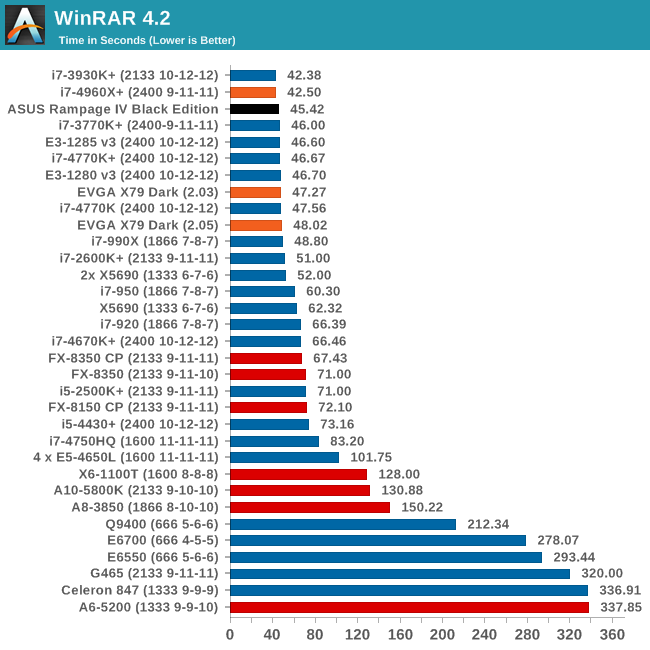
Image Manipulation - FastStone Image Viewer 4.2
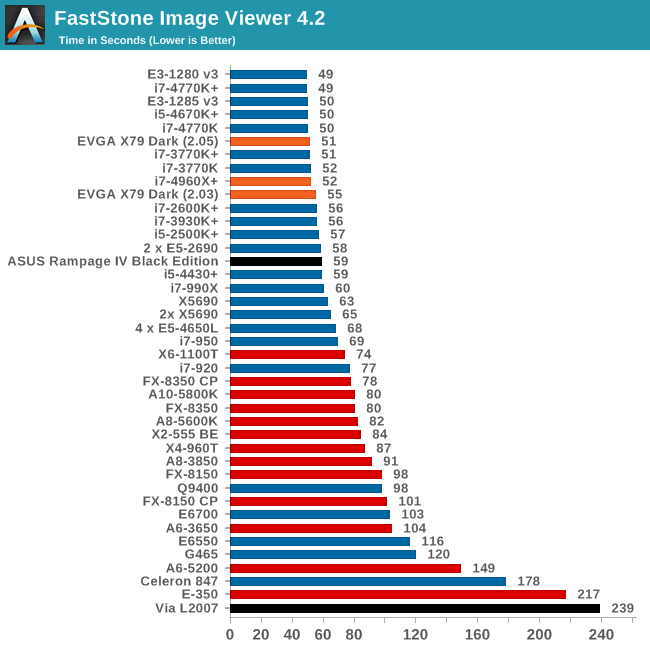
FastStone Image Viewer is a free piece of software I have been using for quite a few years now. It allows quick viewing of flat images, as well as resizing, changing color depth, adding simple text or simple filters. It also has a bulk image conversion tool, which we use here. The software currently operates only in single-thread mode, which should change in later versions of the software. For this test, we convert a series of 170 files, of various resolutions, dimensions and types (of a total size of 163MB), all to the .gif format of 640x480 dimensions.
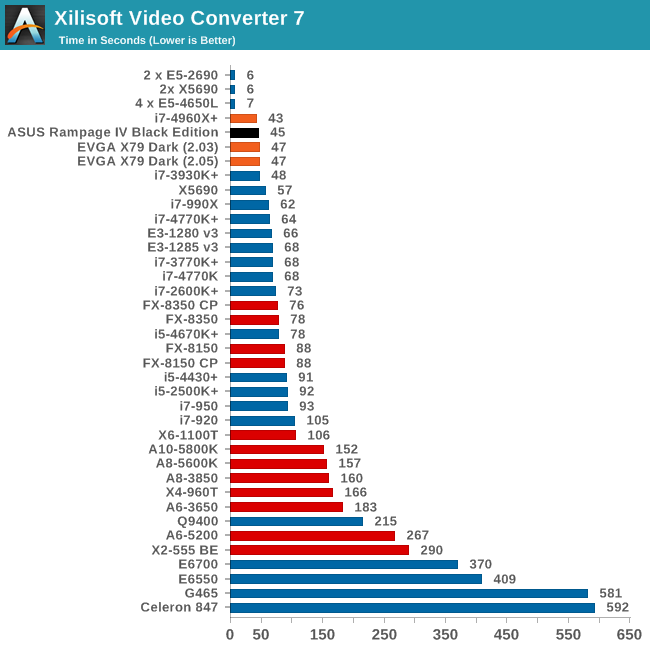
Video Conversion - Xilisoft Video Converter 7
With XVC, users can convert any type of normal video to any compatible format for smartphones, tablets and other devices. By default, it uses all available threads on the system, and in the presence of appropriate graphics cards, can utilize CUDA for NVIDIA GPUs as well as AMD WinAPP for AMD GPUs. For this test, we use a set of 33 HD videos, each lasting 30 seconds, and convert them from 1080p to an iPod H.264 video format using just the CPU. The time taken to convert these videos gives us our result.
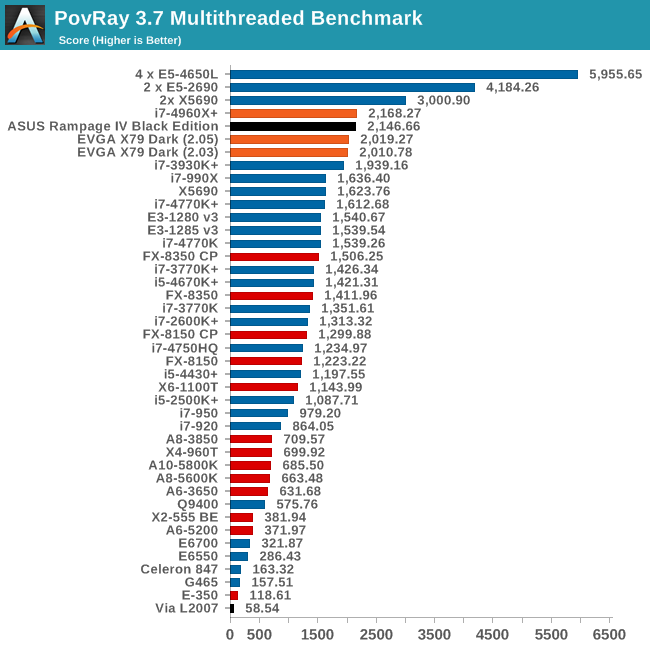
Rendering – PovRay 3.7
The Persistence of Vision RayTracer, or PovRay, is a freeware package for as the name suggests, ray tracing. It is a pure renderer, rather than modeling software, but the latest beta version contains a handy benchmark for stressing all processing threads on a platform. We have been using this test in motherboard reviews to test memory stability at various CPU speeds to good effect – if it passes the test, the IMC in the CPU is stable for a given CPU speed. As a CPU test, it runs for approximately 2-3 minutes on high end platforms.
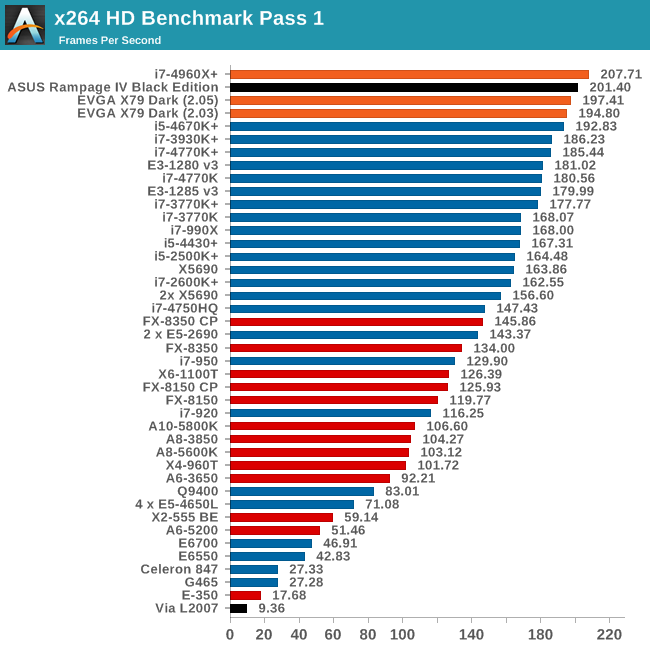
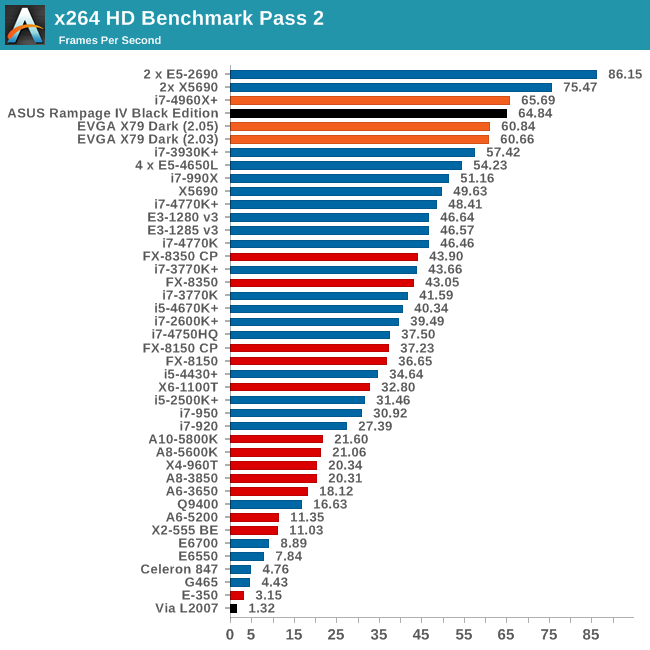
Video Conversion - x264 HD Benchmark
The x264 HD Benchmark uses a common HD encoding tool to process an HD MPEG2 source at 1280x720 at 3963 Kbps. This test represents a standardized result which can be compared across other reviews, and is dependent on both CPU power and memory speed. The benchmark performs a 2-pass encode, and the results shown are the average of each pass performed four times.
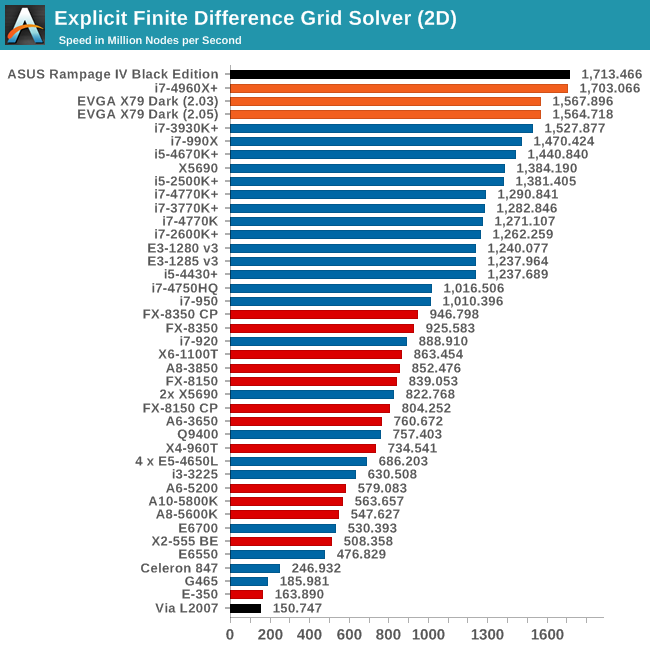
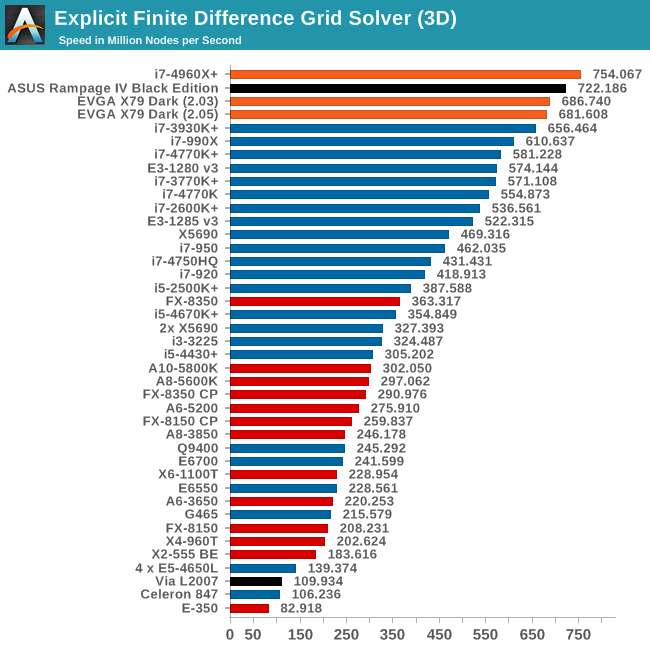
Grid Solvers - Explicit Finite Difference
For any grid of regular nodes, the simplest way to calculate the next time step is to use the values of those around it. This makes for easy mathematics and parallel simulation, as each node calculated is only dependent on the previous time step, not the nodes around it on the current calculated time step. By choosing a regular grid, we reduce the levels of memory access required for irregular grids. We test both 2D and 3D explicit finite difference simulations with 2n nodes in each dimension, using OpenMP as the threading operator in single precision. The grid is isotropic and the boundary conditions are sinks. Values are floating point, with memory cache sizes and speeds playing a part in the overall score.
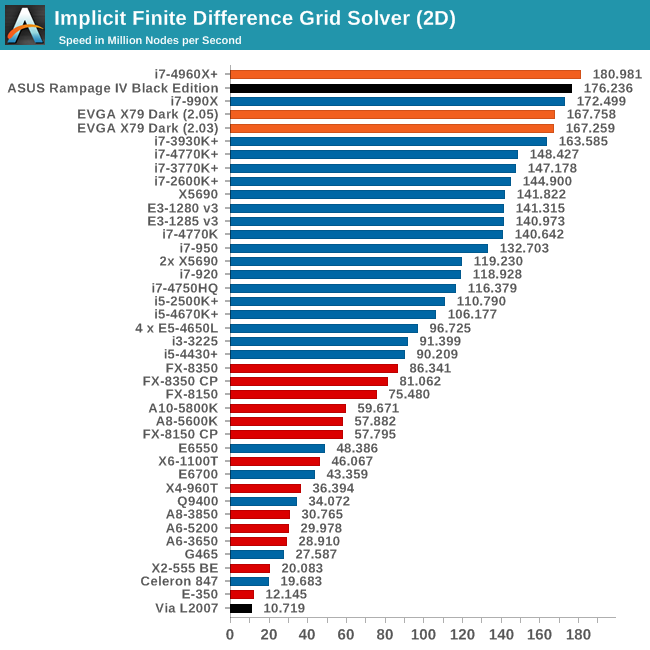
Grid Solvers - Implicit Finite Difference + Alternating Direction Implicit Method
The implicit method takes a different approach to the explicit method – instead of considering one unknown in the new time step to be calculated from known elements in the previous time step, we consider that an old point can influence several new points by way of simultaneous equations. This adds to the complexity of the simulation – the grid of nodes is solved as a series of rows and columns rather than points, reducing the parallel nature of the simulation by a dimension and drastically increasing the memory requirements of each thread. The upside, as noted above, is the less stringent stability rules related to time steps and grid spacing. For this we simulate a 2D grid of 2n nodes in each dimension, using OpenMP in single precision. Again our grid is isotropic with the boundaries acting as sinks. Values are floating point, with memory cache sizes and speeds playing a part in the overall score.
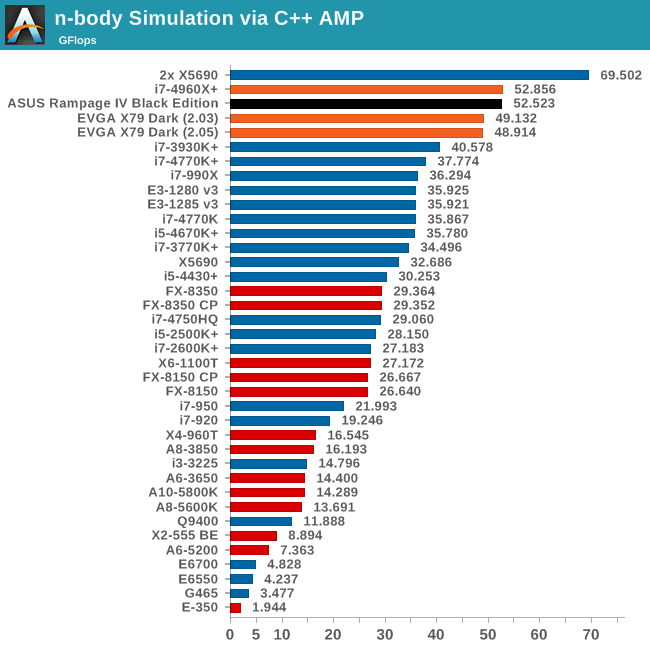
Point Calculations - n-Body Simulation
When a series of heavy mass elements are in space, they interact with each other through the force of gravity. Thus when a star cluster forms, the interaction of every large mass with every other large mass defines the speed at which these elements approach each other. When dealing with millions and billions of stars on such a large scale, the movement of each of these stars can be simulated through the physical theorems that describe the interactions. The benchmark detects whether the processor is SSE2 or SSE4 capable, and implements the relative code. We run a simulation of 10240 particles of equal mass - the output for this code is in terms of GFLOPs, and the result recorded was the peak GFLOPs value.


21 Comments
View All Comments
JlHADJOE - Sunday, January 5, 2014 - link
Wait, so the Auto-OC actually beat your manual OC results? Impressive!The table says Auto-OC managed to get 47/47/46/46/45/45 stable where your manual OC maxed out at 45, and it also got 45x100 stable at less volts and lower temps than manual.
Razorbak86 - Sunday, January 5, 2014 - link
The PovRay score for the 45x100 manual OC was higher, the voltage was lower, and the OCCT temp was lower. I'd say the 4.5GHz manual OC beat the Auto-OC hands down.JlHADJOE - Monday, January 6, 2014 - link
Auto OC: 45x100, 1.400V BIOS, 1.408V load, 77CManual OC: 45x100, 1.425V BIOS, 1.440V load, 80C
Slightly higher Povray is probably just variance, or down to something other than the CPU (perhaps XMP timings). I'd say the Auto-OC was better.
IanCutress - Sunday, January 5, 2014 - link
For the manual OC I only adjust the voltage, CPU multiplier and the CPU load line calibration, which is pretty much what most users will do when manually overclocking unless told otherwise (or there's another setting you must adjust). It's clear the Auto-OC does a bit more under the hood (VCCSA/VSSIO voltages most likely) - at the expense of a higher voltage (to catch more processors). In my test, I also only focus on all cores the same speed, and the stress test attacks all cores, rather than single cores that might be higher turboed. There is scope to go playing around with all the settings, which is what the ROG forums are there to do for users who have only one motherboard every couple of years to organise :)jasonelmore - Sunday, January 5, 2014 - link
I've found that disabling the C States of power saving features such as speed step has drastically improved my max overclock on the Rampage IV Extereme BESamus - Sunday, January 5, 2014 - link
$500!? yeooow.Gen-An - Sunday, January 5, 2014 - link
Ian,Have you seen any noticeable difference in memory OC using the Black Edition vs the original RIVE with the same CPU and RAM? People on various forums are saying the BE is more optimized for IB-E and memory OC, but I haven't been able to find anything definitive to support that statement.
jigglywiggly - Sunday, January 5, 2014 - link
why's the first picture skewed lol?great review as always ;D
IanCutress - Sunday, January 5, 2014 - link
I haven't stressed the RIVE with Ivy-E and high (2800+) memory yet, although this motherboard was designed with Ivy Bridge-E as the focus after ASUS finished the Maximus VI range. So if there are optimisations for Ivy-E above the RIVE that are more than just BIOS, the RIVBE should have them. So while I don't have any data, I expect that would be the case. Now whether faster memory is actually useful for a given workload is a different matter...Gen-An - Wednesday, January 8, 2014 - link
Just interested for the OC fun factor, 24/7 I run DDR3-2400 C9.