The Seagate 600 & 600 Pro SSD Review
by Anand Lal Shimpi on May 7, 2013 8:00 AM ESTAnandTech Storage Bench 2011
Two years ago we introduced our AnandTech Storage Bench, a suite of benchmarks that took traces of real OS/application usage and played them back in a repeatable manner. I assembled the traces myself out of frustration with the majority of what we have today in terms of SSD benchmarks.
Although the AnandTech Storage Bench tests did a good job of characterizing SSD performance, they weren't stressful enough. All of the tests performed less than 10GB of reads/writes and typically involved only 4GB of writes specifically. That's not even enough exceed the spare area on most SSDs. Most canned SSD benchmarks don't even come close to writing a single gigabyte of data, but that doesn't mean that simply writing 4GB is acceptable.
Originally I kept the benchmarks short enough that they wouldn't be a burden to run (~30 minutes) but long enough that they were representative of what a power user might do with their system.
Not too long ago I tweeted that I had created what I referred to as the Mother of All SSD Benchmarks (MOASB). Rather than only writing 4GB of data to the drive, this benchmark writes 106.32GB. It's the load you'd put on a drive after nearly two weeks of constant usage. And it takes a *long* time to run.
1) The MOASB, officially called AnandTech Storage Bench 2011 - Heavy Workload, mainly focuses on the times when your I/O activity is the highest. There is a lot of downloading and application installing that happens during the course of this test. My thinking was that it's during application installs, file copies, downloading and multitasking with all of this that you can really notice performance differences between drives.
2) I tried to cover as many bases as possible with the software I incorporated into this test. There's a lot of photo editing in Photoshop, HTML editing in Dreamweaver, web browsing, game playing/level loading (Starcraft II & WoW are both a part of the test) as well as general use stuff (application installing, virus scanning). I included a large amount of email downloading, document creation and editing as well. To top it all off I even use Visual Studio 2008 to build Chromium during the test.
The test has 2,168,893 read operations and 1,783,447 write operations. The IO breakdown is as follows:
| AnandTech Storage Bench 2011 - Heavy Workload IO Breakdown | ||||
| IO Size | % of Total | |||
| 4KB | 28% | |||
| 16KB | 10% | |||
| 32KB | 10% | |||
| 64KB | 4% | |||
Only 42% of all operations are sequential, the rest range from pseudo to fully random (with most falling in the pseudo-random category). Average queue depth is 4.625 IOs, with 59% of operations taking place in an IO queue of 1.
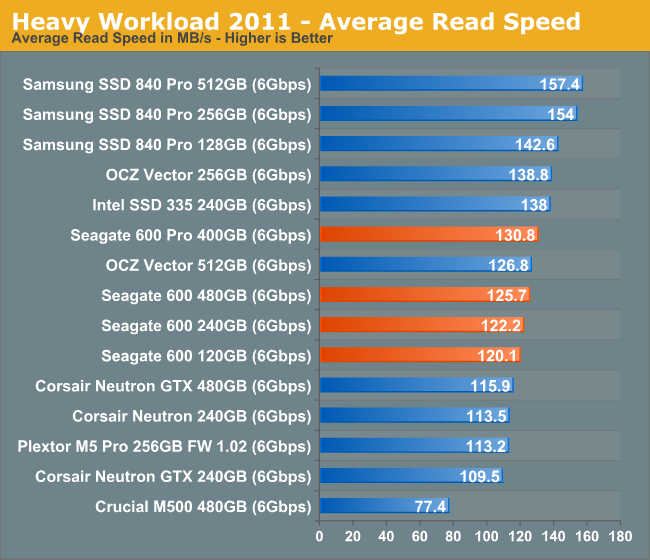
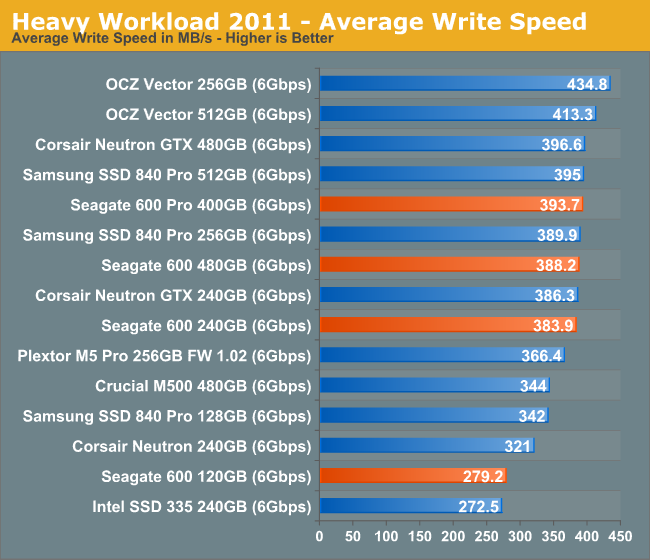
Many of you have asked for a better way to really characterize performance. Simply looking at IOPS doesn't really say much. As a result I'm going to be presenting Storage Bench 2011 data in a slightly different way. We'll have performance represented as Average MB/s, with higher numbers being better. At the same time I'll be reporting how long the SSD was busy while running this test. These disk busy graphs will show you exactly how much time was shaved off by using a faster drive vs. a slower one during the course of this test. Finally, I will also break out performance into reads, writes and combined. The reason I do this is to help balance out the fact that this test is unusually write intensive, which can often hide the benefits of a drive with good read performance.
There's also a new light workload for 2011. This is a far more reasonable, typical every day use case benchmark. Lots of web browsing, photo editing (but with a greater focus on photo consumption), video playback as well as some application installs and gaming. This test isn't nearly as write intensive as the MOASB but it's still multiple times more write intensive than what we were running in 2010.
As always I don't believe that these two benchmarks alone are enough to characterize the performance of a drive, but hopefully along with the rest of our tests they will help provide a better idea.
The testbed for Storage Bench 2011 has changed as well. We're now using a Sandy Bridge platform with full 6Gbps support for these tests.
AnandTech Storage Bench 2011 - Heavy Workload
We'll start out by looking at average data rate throughout our new heavy workload test:
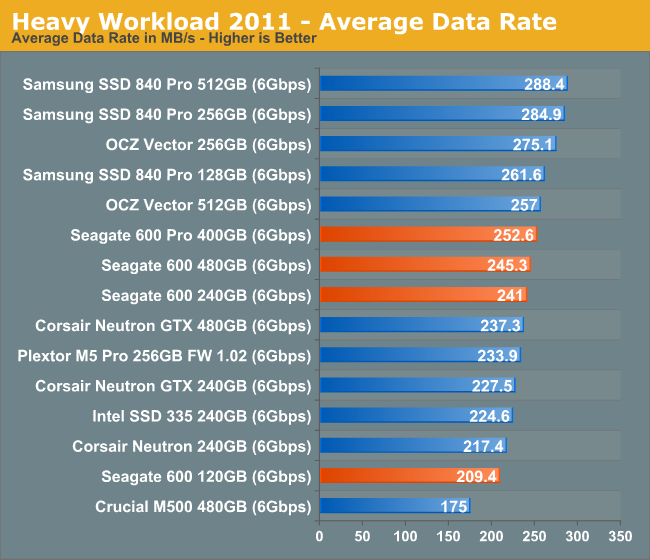
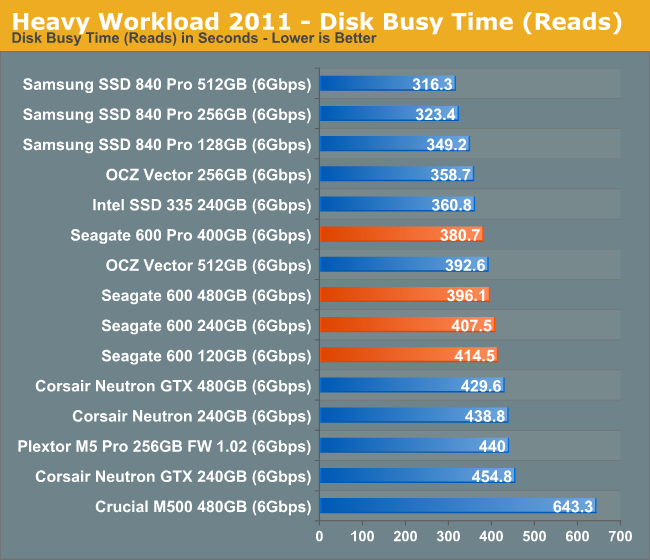
Seagate's 600 does reasonably well here, but if you don't take into account IO consistency then the 600/600 Pro are still behind Samsung's SSD 840 Pro.
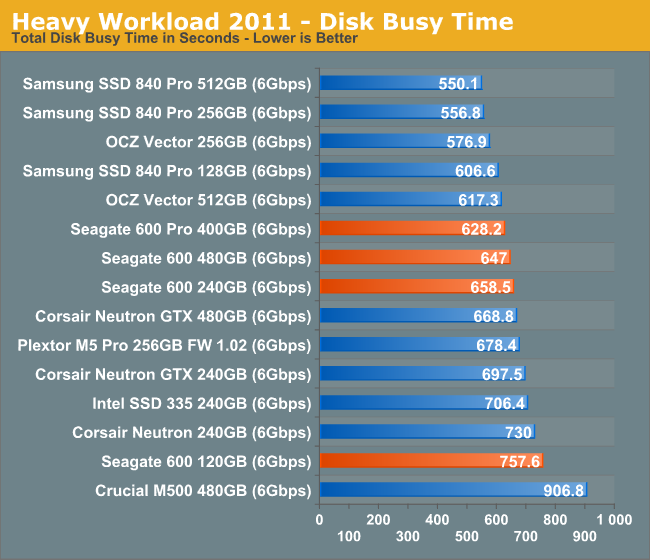
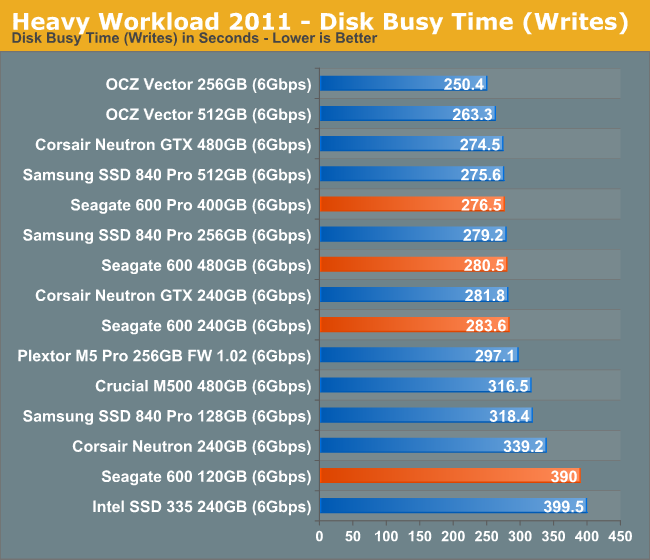
The next three charts just represent the same data, but in a different manner. Instead of looking at average data rate, we're looking at how long the disk was busy for during this entire test. Note that disk busy time excludes any and all idles, this is just how long the SSD was busy doing something:


59 Comments
View All Comments
numberoneoppa - Tuesday, May 7, 2013 - link
It's too bad about the idle power consumption, but if the prices are decent, I might pick up a higher capacity variant to replace my 80GB m25 G2 in my desktop.ssj3gohan - Tuesday, May 7, 2013 - link
I don't think Anandtech has implemented their improved (DIPM-enabled) power consumption tests yet, so the idle figures here are pretty much meaningless. When it comes to market, check the datasheet for actual idle power consumption.Kristian Vättö - Tuesday, May 7, 2013 - link
Seagate's datasheet shows average idle power of 1.1W: http://images.anandtech.com/doci/6935/Screen%20Sho...lightsout565 - Wednesday, May 8, 2013 - link
Does anyone know how power consumption compares to the 128GB Samsung 830? In Anand's review of the 830 he mentions, "Samsung sampled the 512GB version of the SSD 830 so it's unclear how much the sheer number of NAND die impacts power consumption here." During the test of the 513GB version, it showed 1.22W at idle.Kristian Vättö - Wednesday, May 8, 2013 - link
The 128GB SSD 830 idles at 0.38W (I think the firmware is also newer, the 512GB had pre-production FW as far as I know). As always, you can find all our SSDs (and other components) in the Bench, here's the 128GB SSD 830:http://www.anandtech.com/bench/Product/533
cactusdog - Tuesday, May 7, 2013 - link
I don't understand why Seagate and WD were so slow in the SSD market. They should have a complete range of SSDs by now. They could have just rebranded OEM drives (if they didn't want to spend money) and would have sold millions just from their name alone. Like Kingston and others did...... I don't get it.Sabresiberian - Tuesday, May 7, 2013 - link
I wonder if the main HD manufacturers here were doing a bit of "American auto industry" thinking. Like "We sold all the gas guzzlers we could make before, how are we supposed to know the general population is going to want cars that get better gas mileage?" Chrysler and GM had to be bailed out twice for that kind of thinking.So, were Seagate and Western Digital thinking "We're selling all the HDs we can make, why should we get into SSDs?" I don't know, but it's an explanation that seems to fit, to my way of thinking anyway.
Powerlurker - Tuesday, May 7, 2013 - link
I think it's more that Seagate and WD have extensive expertise in manufacturing HDDs that can't be replicated by competitors and lots of industrial infrastructure that only they (and Toshiba at this point) have. Meanwhile, on the SSD front, they would be competing with any idiot on the Pacific Rim with a reference design and a pick-and-place line. SSDs are rapidly becoming commodity products at the consumer level and long term profitability in the segment requires you to have your own special sauce (controller technology, firmware expertise, a NAND fab, or some other unique advantage) which WD and Seagate don't really have at this point.Kristian Vättö - Tuesday, May 7, 2013 - link
While WD and Seagate lack the SSD expertise, they have the distribution channels and resources. Hynix is a good example of a company that has all the expertise they need to develop a competitive SSD but their distribution channel is lacking. Seagate, on the other hand, operates globally and can reach billions of potential buyers in a short period of time. Even if you have a good product, it's fairly meaningless if it can't reach most of the market. Hynix actually makes SSDs but they are doing absolutely nothing to market them and I bet they don't have many distributors in the US or other Western countries (NewEgg sells their SSDs but I haven't seen them elsewhere).Seagate also has tons of capital to invest on the SSD market. Like in the case of this SSD, they didn't just go with stock SandForce but chose LAMD and invested on specializing the firmware. On top of that, I'm pretty sure Seagate has fairly big NAND deals with Toshiba and Samsung to ensure a steady supply of NAND, which requires capital. There have already been NAND shortages in the market and this year it will get even tougher - Seagate has an advantage because they can buy a ton of NAND whereas smaller players lack the capital for that (and the bigger client you are, the more important you are for the company so big clients are prioritized when there's a shortage).
What would be a killer combination in the future is Seagate and Hynix combining their powers.
secretAgent! - Tuesday, May 7, 2013 - link
WD is coming out soon with SSD PCIe cards soon.... i've helped test them.... shhhh....