The Full Intel SSD 525 Review: 30GB, 60GB, 120GB, 180GB & 240GB Tested
by Anand Lal Shimpi on February 3, 2013 2:30 AM EST- Posted in
- Storage
- SSDs
- Intel
- SandForce
- Intel SSD 520
- Intel SSD 525
AnandTech Storage Bench 2011
Two years ago we introduced our AnandTech Storage Bench, a suite of benchmarks that took traces of real OS/application usage and played them back in a repeatable manner. I assembled the traces myself out of frustration with the majority of what we have today in terms of SSD benchmarks.
Although the AnandTech Storage Bench tests did a good job of characterizing SSD performance, they weren't stressful enough. All of the tests performed less than 10GB of reads/writes and typically involved only 4GB of writes specifically. That's not even enough exceed the spare area on most SSDs. Most canned SSD benchmarks don't even come close to writing a single gigabyte of data, but that doesn't mean that simply writing 4GB is acceptable.
Originally I kept the benchmarks short enough that they wouldn't be a burden to run (~30 minutes) but long enough that they were representative of what a power user might do with their system.
Not too long ago I tweeted that I had created what I referred to as the Mother of All SSD Benchmarks (MOASB). Rather than only writing 4GB of data to the drive, this benchmark writes 106.32GB. It's the load you'd put on a drive after nearly two weeks of constant usage. And it takes a *long* time to run.
1) The MOASB, officially called AnandTech Storage Bench 2011 - Heavy Workload, mainly focuses on the times when your I/O activity is the highest. There is a lot of downloading and application installing that happens during the course of this test. My thinking was that it's during application installs, file copies, downloading and multitasking with all of this that you can really notice performance differences between drives.
2) I tried to cover as many bases as possible with the software I incorporated into this test. There's a lot of photo editing in Photoshop, HTML editing in Dreamweaver, web browsing, game playing/level loading (Starcraft II & WoW are both a part of the test) as well as general use stuff (application installing, virus scanning). I included a large amount of email downloading, document creation and editing as well. To top it all off I even use Visual Studio 2008 to build Chromium during the test.
The test has 2,168,893 read operations and 1,783,447 write operations. The IO breakdown is as follows:
| AnandTech Storage Bench 2011 - Heavy Workload IO Breakdown | ||||
| IO Size | % of Total | |||
| 4KB | 28% | |||
| 16KB | 10% | |||
| 32KB | 10% | |||
| 64KB | 4% | |||
Only 42% of all operations are sequential, the rest range from pseudo to fully random (with most falling in the pseudo-random category). Average queue depth is 4.625 IOs, with 59% of operations taking place in an IO queue of 1.
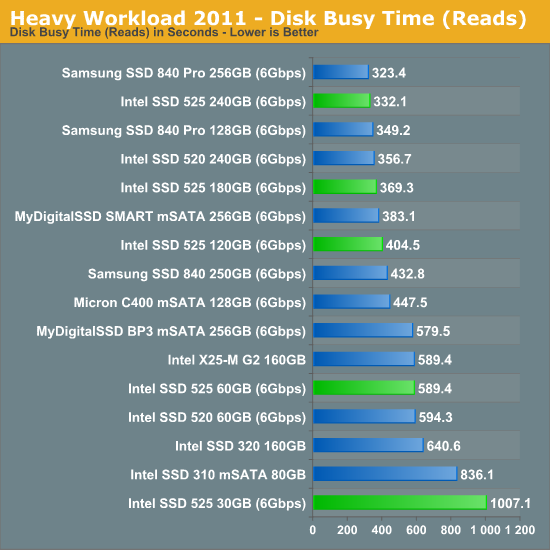
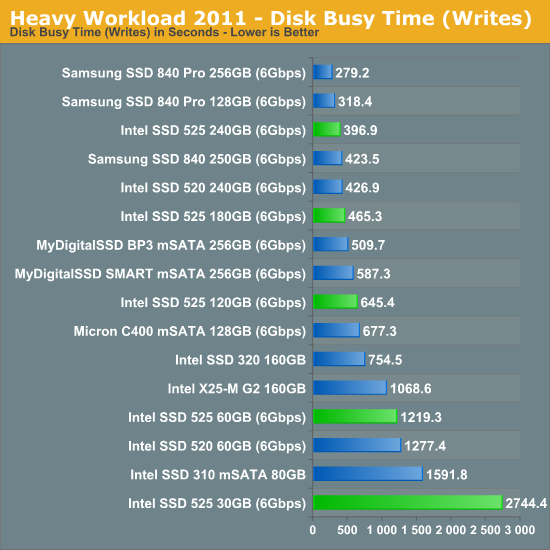
Many of you have asked for a better way to really characterize performance. Simply looking at IOPS doesn't really say much. As a result I'm going to be presenting Storage Bench 2011 data in a slightly different way. We'll have performance represented as Average MB/s, with higher numbers being better. At the same time I'll be reporting how long the SSD was busy while running this test. These disk busy graphs will show you exactly how much time was shaved off by using a faster drive vs. a slower one during the course of this test. Finally, I will also break out performance into reads, writes and combined. The reason I do this is to help balance out the fact that this test is unusually write intensive, which can often hide the benefits of a drive with good read performance.
There's also a new light workload for 2011. This is a far more reasonable, typical every day use case benchmark. Lots of web browsing, photo editing (but with a greater focus on photo consumption), video playback as well as some application installs and gaming. This test isn't nearly as write intensive as the MOASB but it's still multiple times more write intensive than what we were running in 2010.
As always I don't believe that these two benchmarks alone are enough to characterize the performance of a drive, but hopefully along with the rest of our tests they will help provide a better idea.
The testbed for Storage Bench 2011 has changed as well. We're now using a Sandy Bridge platform with full 6Gbps support for these tests.
AnandTech Storage Bench 2011 - Heavy Workload
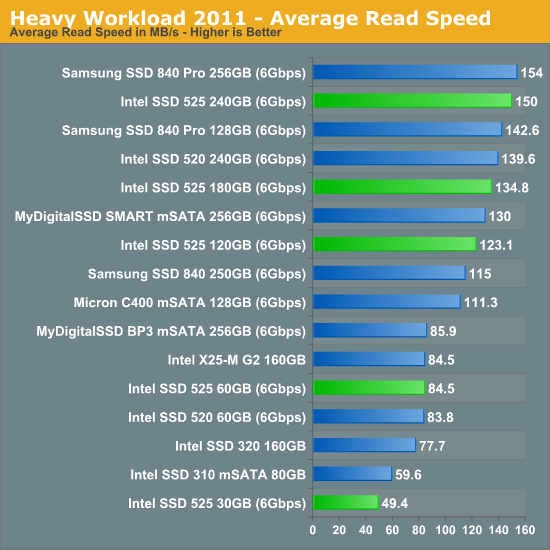
We'll start out by looking at average data rate throughout our new heavy workload test:

Overall performance of the 60GB 525 is similar to the old X25-M G2, which is pretty impressive when you consider the size of the 60GB mSATA drive. Other interesting comparisons include the 120GB 525 narrowly beating Micron's 128GB C400 mSATA drive, and the 180GB model outperforming the two MyDigitalSSD solutions.
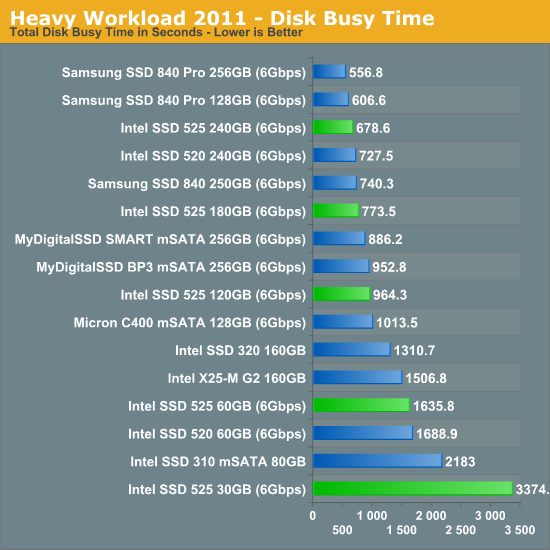
The next three charts just represent the same data, but in a different manner. Instead of looking at average data rate, we're looking at how long the disk was busy for during this entire test. Note that disk busy time excludes any and all idles, this is just how long the SSD was busy doing something:


26 Comments
View All Comments
PolarisOrbit - Monday, February 4, 2013 - link
The comparison table on the first page indicates a 90GB drive and then it's never mentioned again in the rest of the article.Denithor - Monday, February 4, 2013 - link
Addressed in the first paragraph:"At the time we only presented performance for a single 240GB drive, however Intel decided to break the mold and send us nearly every capacity in the 525 lineup."
I would imagine that the 90GB model is the one they didn't provide.
AndrewDobie - Monday, February 4, 2013 - link
Love my job, since I've been bringing in $5600… I sit at home, music playing while I work in front of my new iMac that I got now that I'm making it online.(Click Home information)http://goo.gl/nY29F
philipma1957 - Monday, February 4, 2013 - link
first what mobo can I buy that will run at sata III speeds.I have 3 mobos with msata's all 3 use sata II speed's.
I have an intel h77 itx
an asrock z77 itx
an asus z77 matx
second question when will the crucial m500 480gb drop?
third question which has nothing to do with msata just sata. when does sata IV come out.
I get a bit bored with ssd reviews since speed is pretty much capped at 550 read write.
iops are not going to go to 550 read write at random 4k.
so sata 4 would mean all new speeds to droll over.
a bigger msata like the crucial m500 would be nice.
and an itx board that used msata at sata III would be nice.
not knocking intel but ssd's seem to have become more of the same.
As Jimmy Fallon would say bigger harder faster stronger.
oh one last thing the 5 year warranty is nice.
Kristian Vättö - Monday, February 4, 2013 - link
Crucial M500 is Q2'13, that's all we know for now. I'm very interested in the drive as well, hopefully we can get samples soon.SATA Express is the future of SATA, we likely won't see SATA IV (12Gbps) for a few years (if we'll ever even see it). We may see some SATAe based SSDs/mobos H2'13 but I haven't heard any specific time frame.
DanNeely - Monday, February 4, 2013 - link
That's disappointing; I was hoping they'd be available by 13Q2 to go along with the Haswell launch since there will be an uptick of enthusiast system building then. Based on prior history my Haswell box will last at least until Skylake launches; and probably until the tick following it four years from now.ssj3gohan - Monday, February 4, 2013 - link
... because I just care that much :DBut seriously, Anandtech. Let's talk logic here. Intel has specification sheets with detailed power consumption numbers. It says for the entire SSD 525 series: 250mW idle typical, 300mW under mobilemark 2007.
How can you look at your own power consumption numbers and say 'well, close enough, let's just publish it even though it's 100% too high and clearly not correct'?
Here's how to fix your SSD power consumption errors: measure power consumption going directly into the drive on all rails and use it in a system that has device initiated power management features enabled (DIPM), that is: basically all operating systems nowadays.
Anand Lal Shimpi - Monday, February 4, 2013 - link
As I mentioned in the review, the mSATA adapter we test with only supplies 5V to the drive. To address this going forward I need to modify a board with a native mSATA connector and measure 3.3V on the board itself. The results here at least allow you to compare the various capacities of the 525.MobileMark 2007 is mostly an idle test, which is why none of our loaded numbers have ever come close to any spec sheet that reports it. This is the same reason we don't use it in our notebook reviews.
We will be switching to DIPM-only testing in our 2013 storage suite update, which will unfortunately break backwards comparability with our older results.
Take care,
Anand
RU482 - Monday, February 4, 2013 - link
Anand,What mSATA adapter board are you using?
Just a thought, you should be able to lift a lead on the 5-to-3.3V regulator on the board and measure the output current with a multi-meter.
extide - Monday, February 4, 2013 - link
Also note that those mSATA to SATA converters use a little linear regulator(like a 7833) to convert the 5v to 3.3v. Linear regulators are very in-efficient, as they essentially turn the "extra" voltage into heat by using a network of resistors.If you are simply measuring the power into the adapter then you are not getting a very good look at the actually mSATA device power draw.
HOWEVER, if someone else is using the adapter in their system they will also be utilizing that same linear regulator, and thus see the same power usage as they show in the article here.