Budget Video Card Comparison - November 2000
by Matthew Witheiler on November 27, 2000 3:20 AM EST- Posted in
- GPUs
CPU Scaling Performance
All the above tests were conducted on an Athlon "Thunderbird" 1.0 GHz processor in order to gain an understanding of how each card performs under the most ideal situation. The truth of the matter, however, is that many users will not be placing a value card such as these in a system of such speed. Although all of these cards make perfect sense for builders of budget systems (even 1.0 GHz Thunderbird based ones), they also make sense for people on the upgrade path.
Since each card matches with processors differently, it is necessary to investigate how each can scale with different processors. For the purposes of this review, we choose two other processors to compare the cards on: a low end Celeron 366 and a medium end Pentium III 550E. To examine how each card scales with the CPU at various resolutions, we will take a look at each card individually and see how it performs under each circumstance.
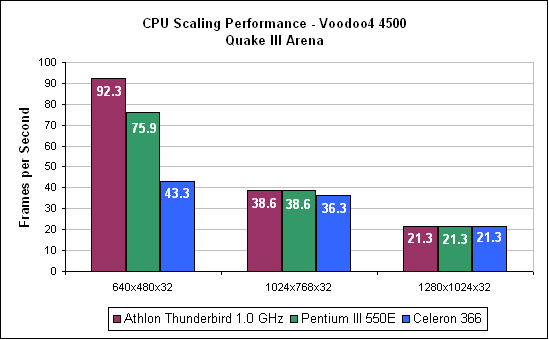
In the case of the Voodoo4 4500, at resolutions above 640x480x32 the card really does not care which CPU it is on. This is a result of hitting a video card bottleneck before any CPU bottleneck is encountered. At 640x480x32, it is clear that the Voodoo4 4500 gains speed from a faster CPU. Once one looks at the 1024x768x32 and 1280x1024x32 numbers, it becomes clear that the CPU is not limiting game play: the Voodoo4 4500 is.
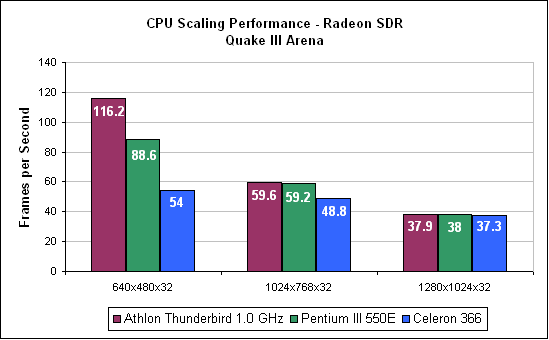
In the case of the Radeon SDR, the card is a bit more picky when it comes to CPU choice. Once again, the card shows dramatic speed fluctuations at 640x480x32, where the video card is not really being challenged at all. Unlike the Voodoo4 4500, the Radeon SDR does show that the CPU choice can matter in budget game cards. The Radeon SDR most certainly prefers any processor of 550 MHz or above, as the substitution of the 366 MHz Celeron decreases performance of the card by 21%. In this case, the CPU is acting as the bottleneck, not the video card. Keep in mind, however, that the lack of performance increase when going from the Pentium III 550E to the Athlon 1.0 GHz processor shows that in these cases the video card is our bottleneck once again. This trend continues, as at 1280x1024x32 the Radeon SDR performs identically on each platform, showing that the video card is the only bottleneck.
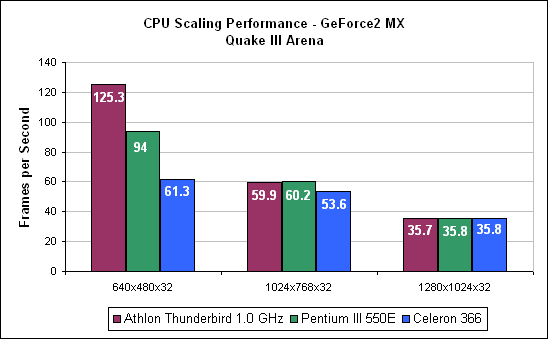
The results of our GeForce2 MX scaling tests reveal an outcome very similar to that of the Radeon SDR. Once again, the CPU that provides a bottleneck at 1024x768x32 is the Celeron 366 MHz, while the other two CPUs show the video card acting as the bottleneck. Performance drops about 12% when going down the the Celeron 366 MHz speed, showing that the GeForce2 MX is a bit less sensitive than the Radeon SDR when it comes to the CPU used. At 1280x1024x32, the card performs the same regardless of processor, showing that the video card is the bottleneck at this resolution.


0 Comments
View All Comments