MSI FM2-A85XA-G65 Review: Know Your Platform
by Ian Cutress on December 11, 2012 1:21 AM EST- Posted in
- Motherboards
- MSI
- FM2
- A85X
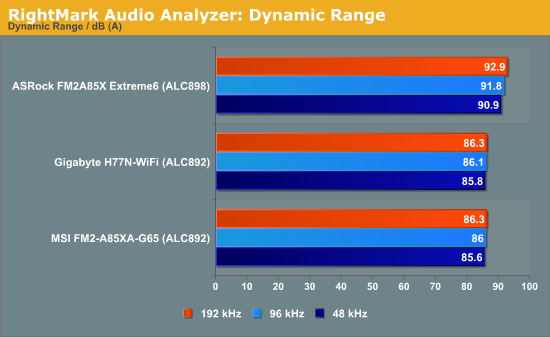
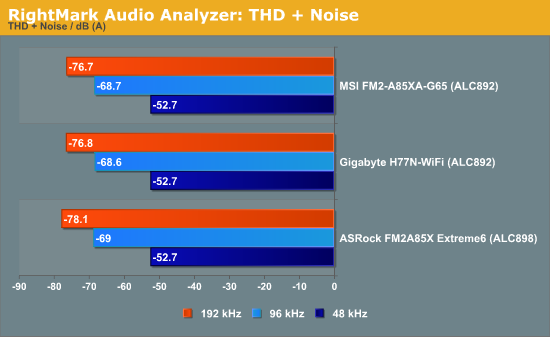
Rightmark Audio Analyzer 6.2.5
In part due to reader requests, we are pleased to include Rightmark Audio Analyzer results in our benchmark suite. The premise behind Rightmark:AA is to test the input and output of the audio system to determine noise levels, range, harmonic distortion, stereo crosstalk and so forth. Rightmark:AA should indicate how well the sound system is built and isolated from electrical interference (either internally or externally). For this test we connect the Line Out to the Line In using a short six inch 3.5mm to 3.5mm high-quality jack, turn the OS volume to 100%, and run the Rightmark default test suite at 48 kHz, 96 kHz and 192 kHz. For brevity, we show the Dynamic Range and THD + Noise results.
USB 3.0 Backup
For this benchmark, we run CrystalDiskMark to determine the ideal sequential read and write speeds for the USB port using our 240 GB OCZ Vertex3 SSD with a SATA 6 Gbps to USB 3.0 converter. Then we transfer a set size of files from the SSD to the USB drive using DiskBench, which monitors the time taken to transfer. The files transferred are a 1.52 GB set of 2867 files across 320 folders – 95% of these files are small typical website files, and the rest (90% of the size) are the videos used in the Video Conversion test.
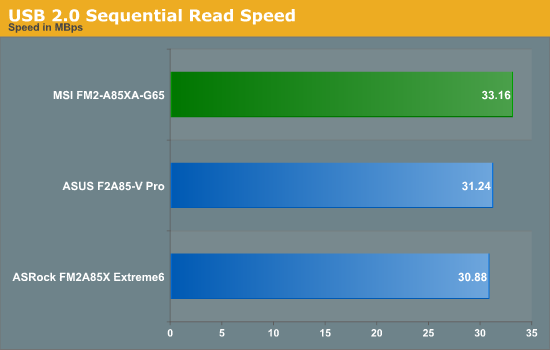
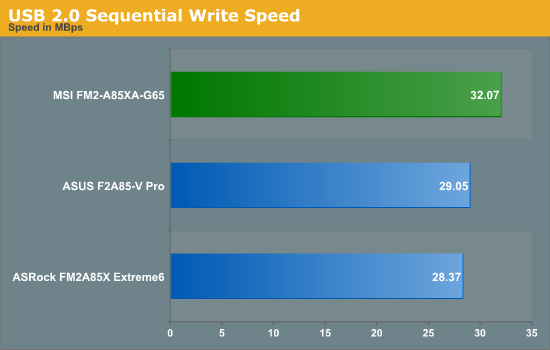
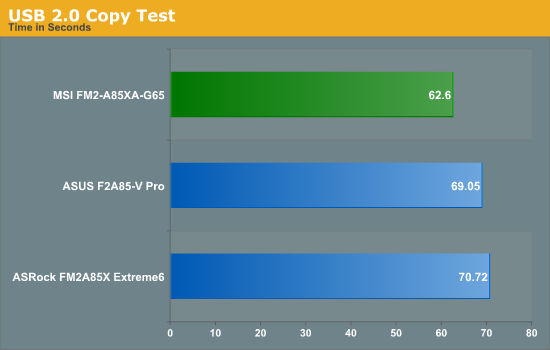
In terms of USB 2.0 performance, the MSI FM2-A85XA-G65 seems to rule the roost compared to other FM2 boards. This could be down to default BIOS options at the expense of the S3 sleep resume.
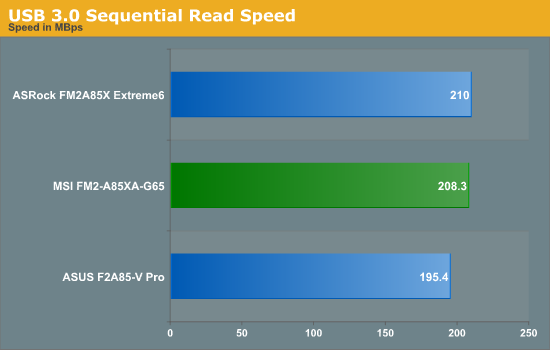

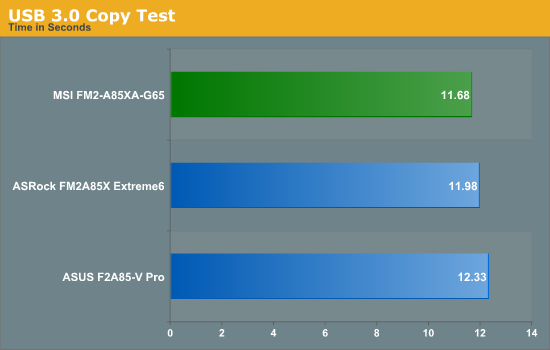
Again, the MSI takes the lead in our chipset USB 3.0 testing.
DPC Latency
Deferred Procedure Call latency is a way in which Windows handles interrupt servicing. In order to wait for a processor to acknowledge the request, the system will queue all interrupt requests by priority. Critical interrupts will be handled as soon as possible, whereas lesser priority requests, such as audio, will be further down the line. So if the audio device requires data, it will have to wait until the request is processed before the buffer is filled. If the device drivers of higher priority components in a system are poorly implemented, this can cause delays in request scheduling and process time, resulting in an empty audio buffer – this leads to characteristic audible pauses, pops and clicks. Having a bigger buffer and correctly implemented system drivers obviously helps in this regard. The DPC latency checker measures how much time is processing DPCs from driver invocation – the lower the value will result in better audio transfer at smaller buffer sizes. Results are measured in microseconds and taken as the peak latency while cycling through a series of short HD videos - less than 500 microseconds usually gets the green light, but the lower the better.
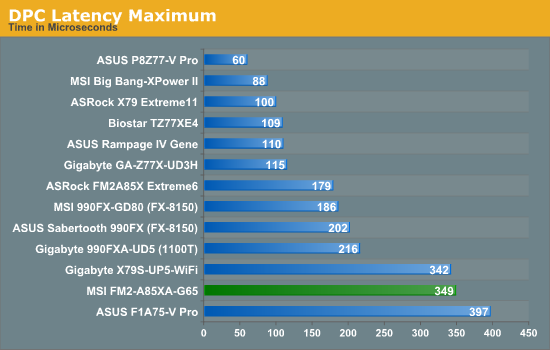
The results from our DPC test are a little startling – the MSI board regularly hit above 200 microseconds and above in our testing, dipping between 100-300 regularly. This is ultimately a poor performance compared to the ideal. If a motherboard gets results like this, then often a priority change in the BIOS can be a cure and results on later BIOSes could vary.


11 Comments
View All Comments
torp - Tuesday, December 11, 2012 - link
It makes no sense to build a system like that, you'd go FM2 if you want to use the integrated video... and then a 3-400W power supply, or even a PicoPSU would suffice.The power consumption test basically gives no useful information.
axelthor - Tuesday, December 11, 2012 - link
If you'd read the article instead of just skimming through it an looking at the graphs you would know why.ssj3gohan - Tuesday, December 11, 2012 - link
Yeah, but just keep in mind that for almost all reviews (especially on anandtech) the power consumption figures are just there as a checkbox feature of the review, they rarely if ever mean something useful. Judging from their more polished reviews and the podcast, it's not a case of lack of intelligence or craftmanship that they bodge up every power measurement, it just seems that they don't have enough time to properly execute this part of a review.So, if I start slagging off these otherwise awesome people I should give them some advice as to how they can properly execute this, right?
First and foremost, and this is not meant as flaming or anything: if you don't know what you're doing, don't publish it. By 'not knowing' I don't mean you're an idiot but I mean that you do not fully understand all aspects of power consumption. Power consumption is a ridiculously complicated matter, it depends not just on recognizable BIOS features, the high-level OS, drivers and hardware composition, but also to a fairly high level on temperature, implementation quirks/bugs and simply offset errors on voltage regulators. The only way to make a truly level playing field is for the reviewer to orthogonalize *all* these factors. Always use the same OS on the same drive with the same BIOS features enabled and verified as working. Measure, directly, the DC power consumption of all non-motherboard components if you just want to isolate the effect of the motherboard. Orthogonalize power distribution by not measuring AC but going for DC power measurements. NEVER extrapolate or guess (e.g. silentpcreview uses a lookup table to go from AC to DC watts, which is categorically wrong), always measure directly. And last but not least: always do a sanity check, look at the manufacturer's data sheets (they are basically always right) and check your findings with other reviewers. It doesn't matter if you differ somewhere, as long as you have a complete explanation of why it differs and why your numbers are correct.
For instance, Anandtech publishes a lot of SSD reviews and always does a power consumption test. These are basically all wrong, as are nigh-on all other SSD power consumption figures on other review sites. They test idle power consumption under a fairly old linux kernel that apparently doesn't understand the DIPM (device initiated power management) power management feature. This is a feature that is supported on every major OS release and chipset since Vista and greatly reduces idle power consumption. The consequence is that measured idle power consumption is galaxies away from actual real-world idle power consumption. Not only that, but they apparently forget that on the first page of their review is a table with manufacturer specs that clearly states *much* lower power consumption. Why doesn't that make them scratch their head and think 'hey... maybe we did something wrong? Shouldn't we go check up on this issue?'. They check every other possible performance metric on these drives and aren't satisfied until everything is explained into great detail, so why not also put some effort into power consumption metrics?
As a result, even though intel specs almost all its consumer drives at 75-150mW idle and 150-400mW load power consumption, all reviews of intel SSDs state their idle power consumption as 0.6W and load at 1.2 or something. So if you're looking for a drive with the lowest possible power consumption for use in e.g. a windows tablet, ultrabook or laptop, you won't find any useful information on the web.
/rant
Wwhat - Wednesday, December 12, 2012 - link
That might scientifically make sense, but in real life the only reason to know the power is to see how much AC you pull and have to pay for (or generate), so in fact you only need to measure the AC pull really.cfaalm - Wednesday, December 12, 2012 - link
I think you're both right. Measuring AC pull is only valid in comparison if you use the same PSU on the same voltage. If you go nitpicking over a couple of mV's then even the efficiency curve of the PSU comes into play. I think it's really hard to get it right.IanCutress - Tuesday, December 11, 2012 - link
In order to keep our testing consistent with ALL other motherboard reviews, we test with multiple GPUs and have to have a power supply capable of 3/4 GPUs at full whack with the CPU as well. We use a 1250W Gold power supply, which as noted in the review has a relatively high efficiency - even more so given that I am on the 240 V input.Two important points:
1) We do not have access to every hardware ever released. In my own testing I use the 1250W gold for desktop environments, and a 500W Platinum for mini-ITX environments, because these are the power supplies I own and allow me to complete testing without spending hours changing everything back and forth. We don't have unlimited space to have 18 test beds set up for individual component XYZ either.
2) Even if you feel the individual values mean nothing to you, then as a comparison against other components put in exactly the same position, conclusions can be drawn as to which is better than the others. You examine the gradient of change rather than the absolute value - a technique used often in scientific circles when the absolutes cannot be obtained.
My testing methodology and scientific background that I do have allow for reasoned interpretation and my testing is equivalent to the rigor I placed in my scientific peer-reviewed papers I published. I never aim to mislead or pre-suppose bias on any bit of kit, and only aim to give the readers the best possible explanation with the tools at my disposal.
woogitboogity - Wednesday, January 2, 2013 - link
It is quite simple. They need to keep things consistent when comparing this motherboard and components to others, including all the crazy SLI/CF rigs. So long as you have a decent power supply in terms of quality the supply will not draw more power than it actually needs.SolMiester - Tuesday, December 11, 2012 - link
What is the point of of building APU, then CF with dGPUS?...ridiculous!..frozentundra123456 - Tuesday, December 11, 2012 - link
I agree with what you are saying, but the tested games were surprisingly playable at demanding settings with the right video card(s). However, I cant see buying such a cheap processor, especially an APU, and pairing it high end cards either.It would have been interesting to test something like a 3570k and FX 6300/8350 under the same conditions (with their appropriate MB of course) to see how much faster they were. Surprisingly, it looks like the tests are GPU bound even with a lowly A10 cpu.
Origin64 - Wednesday, December 12, 2012 - link
I still don't get why people are getting so worked up about this. 2.0 x8 offers 95% of the performance, x16 something like 99. We don't need PCIe 3.0 yet. Probably won't for another year or two, at least.