Gigabyte GA-A55M-S2V Review
by Brendan van Varik on March 21, 2012 9:00 PM EST- Posted in
- Motherboards
- Gigabyte
- Llano
- A55
3D Movement Algorithm Test
The algorithms in 3DPM employ both uniform random number generation or normal distribution random number generation, and vary in various amounts of trigonometric operations, conditional statements, generation and rejection, fused operations, etc. The benchmark runs through six algorithms for a specified number of particles and steps, and calculates the speed of each algorithm, then sums them all for a final score. This is an example of a real world situation that a computational scientist may find themselves in, rather than a pure synthetic benchmark. The benchmark is also parallel between particles simulated, and we test the single thread performance as well as the multi-threaded performance.
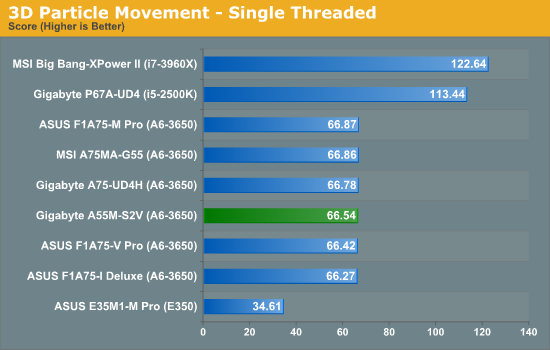
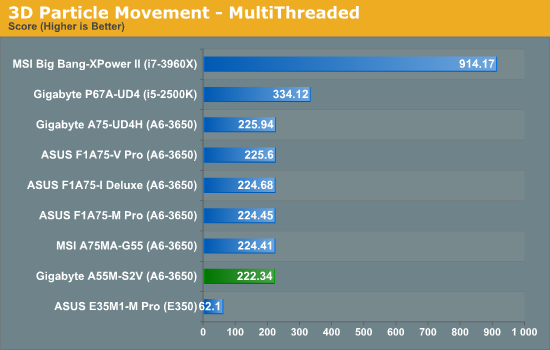
While single threaded performance is average, the performance in a multithreaded environment leaves this motherboard standing in last place in the Llano section. Nevertheless, the board is within statistical variations.
WinRAR x64 3.93 - link
With 64-bit WinRAR, we compress the set of files used in the USB speed tests. WinRAR x64 3.93 attempts to use multithreading when possible.
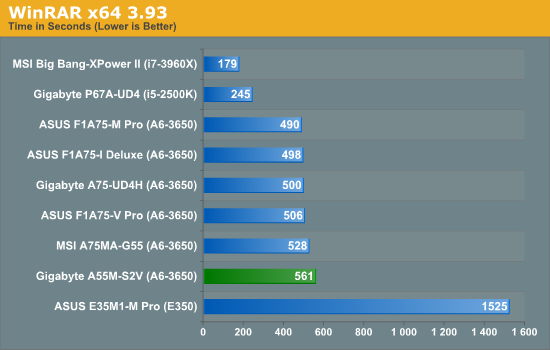
WinRAR attempts to use multithreading as much as possible and as demonstrated in our previous tests with the 3D Movement benchmark, multithreaded applications are not the strong point of this motherboard and it has given us a much slower result.
FastStone Image Viewer 4.2 - link
FastStone Image Viewer is a free piece of software I have been using for quite a few years now. It allows quick viewing of flat images, as well as resizing, changing color depth, adding simple text or simple filters. It also has a bulk image conversion tool, which we use here. The software currently operates only in single-thread mode, which should change in later versions of the software. For this test, we convert a series of 170 files, of various resolutions, dimensions and types (of a total size of 163MB), all to the .gif format of 640x480 dimensions.
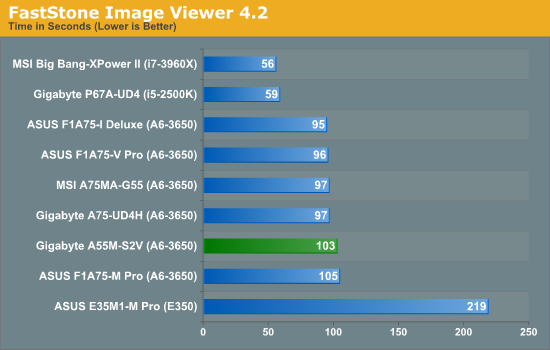
The S2V is not the slowest of the bunch but it is by no means the quickest either.
Sorenson Squeeze 6.0 - link
Sorenson Squeeze is a professional video encoder, complete with a vast array of options. For this test, we convert 32 HD videos, each a minute long and approximately 42 MB in size, to WMV 512KBps format. Squeeze can encode multiple videos at once, one for each thread.
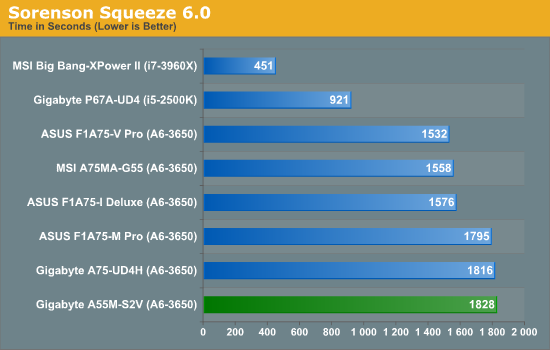
Our Squeeze test is heavily multithreaded and this result proves yet again that the multithreaded aspect of this motherboard is not strong enough to compete.


21 Comments
View All Comments
DMisner - Wednesday, March 21, 2012 - link
Isn't FM1 on the way out with Trinity's upcoming release?HW_mee - Thursday, March 22, 2012 - link
Yes it is, FM2 is the next socket for desktop Trinity, but I have not ben able to find any information on compatibility between FM1 and2.Some rumors claim that the current chipsets will work with the FM2 socket, but no info an the processors :-(
Feel free to add more rumors/info :-)
MonkeyPaw - Friday, March 23, 2012 - link
I thought I read that AMD had one last upgrade for FM1. It was assumed (hoped) they meant Trinity.Not sure what FM2 will offer that's different. Maybe add more memory channels?
mariush - Thursday, March 22, 2012 - link
Again with 1000w+ power supplies on systems designed to use 50-100 watts...No power supply manufacturer will optimize its power supplies to have good efficiency below below the 20%, which is what 50-100 watts will be on this 1250w psu.
As you can see on techpowerup.com/reviews/OCZ/ZX_1250W/5.html this power supply has 66% efficiency at 65 watts and 75% efficiency at 90 watts.
"These are the real world values that consumers may expect from a typical system (minus the monitor) using this motherboard."
No, they absolutely are not. Even if customers would buy cheap 350-500w power supplies, those would do 80% efficiency at even 60 watts load.
mariush - Thursday, March 22, 2012 - link
And who the hell is going to buy a 130$+ video card such a factory overclocked Radeon 5850 when the motherboard is supposed to targeted to value users?Value users are going to either use the integrated video card (why no power consumption values WITHOUT a video card?) which is good enough to watch movies or even play games like World of Warcraft or they're going to get something like a sub 100$ 5750 or a 6750.
It doesn't make a big difference at idle, but it sure does at high loads, and some people are just concerned enough to compare power consumptions and lean to a solution or another based just on this.
HW_mee - Thursday, March 22, 2012 - link
Yeah, this is standard, as the "anand" testbed and it has to be as similar as possible across all the systems they test from i7 3960X to an E-350.I do not accuse anand of foul play, but it is not really a fit setup for mid to low performance systems.
If you want a proper look at Llano, Brazos or similar and what they offer in a "daily" scenario, you can try looking at the SPCR reviews of these platforms.
tim851 - Thursday, March 22, 2012 - link
Well, they say it's to make things comparable. But then they have power consumption charts where some systems use different components than others. And they don't put it in the chart.So one system was tested with a Radeon 5870 (low idle) and Windows 7 and another system was tested with a GeForce GTX 285 (~20-30w higher idle) and Windows XP and they don't mark it on the charts.
Typically they misrepresent AMD that way.
Has to be said.
I haven't used AMD (on the cpu side) myself in a long time, but I feel they are getting an undeservedly bad rep on tech sites.
mariush - Thursday, March 22, 2012 - link
I don't buy it. I understand the concept but I don't buy it.Such a popular website like Anandtech with reasonable income from advertising can very well keep 2-3 power supplies for tests, in order to provide accurate, correct reviews.
A 600w power supply is good enough to run benchmarks on virtually ANY processor and single video card combination, even when overclocked.
With 2 or more video cards, you can very well change the power supply to a 1000w+ one.
Changing power supplies takes minutes on a test bed.
Anandtech could also just buy a batch of power supplies from the same series (to have a few as backup in case one or several break) and put them through a load tester, to get the efficiency graph, one similar to the one in the Tech Power Up article I linked.
From that point, as they have the efficiency graph, they can just measure the power consumption at the wall and estimate how much the system actually uses.
It won't be 100% exact as the ratio between 3.3v, 5v and 12v rail usage will vary between systems, but as 12v is a large percent of usage nowadays, it will be within a few percents. Close enough.
HW_mee - Thursday, March 22, 2012 - link
I do not like it either, but remember that Anandtech is not written by people in on physical location.I know some of the contributors are located in different parts of Europe, and I am pretty sure they have some people scattered across the US as well. They cannot ship the same equipment between all these locations and it looks like they have purchased somewhat similar equipment for use in their test.
This 1000 watt supply is then a part of the "testbench" and you will have to visit other sites for for more realistic power/efficiency numbers when reading a review of a part that is not high end.
mariush - Thursday, March 22, 2012 - link
ಠ_ಠThis is just another point for computing the efficiency graph of the power supply and report the estimated real usage of the system
We all know efficiency of a power supply changes when running from 110-120v (us) compared to running from 230v.
The 65w idle on 230v in Europe can very well be 70w in US, due to less efficiency when running on US mains power.
It would be more honest to report the actual consumption, after factoring losses in psu.