OCZ's Vertex 2 Pro Preview: The Fastest MLC SSD We've Ever Tested
by Anand Lal Shimpi on December 31, 2009 12:00 AM EST- Posted in
- Storage
Sequential Performance - Virtually Bound by 3Gbps SATA
Most high end SSDs have sequential read speeds that are pretty much bound by existing 3Gbps SATA interfaces:
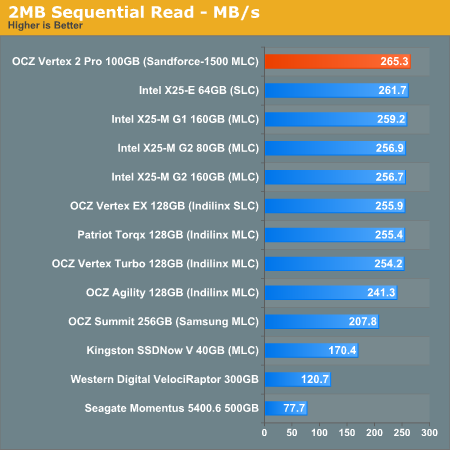
OCZ’s Vertex 2 Pro is no different. At around 265MB/s, we’d need to have a redesigned version of the controller with 6Gbps SATA support to go any faster.
It’s the sequential write speed that’s just freakin’ ridiculous:
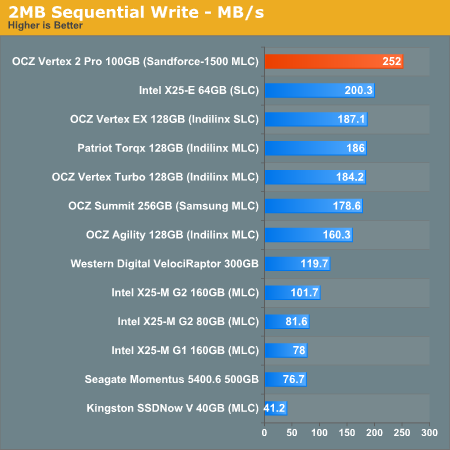
At 252MB/s the Vertex 2 Pro delivers more sequential write speed than even the best SLC based SSDs. We’re almost bound by 3Gbps SATA here!


100 Comments
View All Comments
Shark321 - Monday, January 25, 2010 - link
Kingston has released a new SSD series (V+) with the Samsung controller. I hope Anandtech will review it soon. Other sites are not reliable, as they test only sequential read/writes.Bobchang - Wednesday, January 20, 2010 - link
Great Article!it's awesome to have new feature SSD and I like the performance
but, regarding your test, I don't get the same random read performance from IOMeter.
Can you let me know what version of IOMeter and configuration you used for the result? I never get more than around 6000 IOPS.
AnnonymousCoward - Wednesday, January 13, 2010 - link
Anand,Your SSD benchmarking strategy has a big problem: there are zero real-world-applicable comparison data. IOPS and PCMark are stupid. For video cards do you look at IOPS or FLOPS, or do you look at what matters in the real world: framerate?
As I said in my post here (http://tinyurl.com/yljqxjg)">http://tinyurl.com/yljqxjg), you need to simply measure time. I think this list is an excellent starting point, for what to measure to compare hard drives:
1. Boot time
2. Time to launch applications
_a) Firefox
_b) Google Earth
_c) Photoshop
3. Time to open huge files
_a) .doc
_b) .xls
_c) .pdf
_d) .psd
4. Game framerates
_a) minimum
_b) average
5. Time to copy files to & from the drive
_a) 3000 200kB files
_b) 200 4MB files
_c) 1 2GB file
6. Other application-specific tasks
What your current strategy lacks is the element of "significance"; is the performance difference between drives significant or insignificant? Does the SandForce cost twice as much as the others and launch applications just 0.2s faster? Let's say I currently don't own an SSD: I would sure like to know that an HDD takes 15s at some task, whereas the Vertex takes 7.1s, the Intel takes 7.0s, and the SF takes 6.9! Then my purchase decision would be entirely based on price! The current benchmarks leave me in the dark regarding this.
rifleman2 - Thursday, January 14, 2010 - link
I think the point made is a good one for an additional data point for the decision buying process. Keep all the great benchmarking data in the article and just add a couple of time measurements so, people can get a feel for how the benchmark numbers translate to time waiting in the real world which is what everyone really wants to know at the end of the day.Also, Anand did you fill the drive to its full capacity with already compressed data and if not, then what happens to performance and reliability when the drive is filled up with already compressed data. From your report it doesn't appear to have enough spare flash capacity to handle a worse case 1:1 ratio and still get decent performance or a endurance lifetime that is acceptable.
AnnonymousCoward - Friday, January 15, 2010 - link
Real world top-level data should be the primary focus and not just "an additional data point".This old article could not be a better example:
http://tinyurl.com/yamfwmg">http://tinyurl.com/yamfwmg
In IOPS, RAID0 was 20-38% faster! Then the loading *time* comparison had RAID0 giving equal and slightly worse performance! Anand concluded, "Bottom line: RAID-0 arrays will win you just about any benchmark, but they'll deliver virtually nothing more than that for real world desktop performance."
AnnonymousCoward - Friday, January 15, 2010 - link
Icing on the cake is this latest Vertex 2 drive, where IOPS don't equal bandwidth.It doesn't make sense to not measure time. Otherwise what you get is inaccurate results to real usage, and no grasp of how significant differences are.
jabberwolf - Friday, August 27, 2010 - link
The better way to test rather then hopping on your mac and thinking thats the end-all be-all of the world is to throw this drive into a server, vmware or xenserver... and create multiple VD sessions.1- see how many you can boot up at the same time and run heavy loads.
The boot ups will take the most IOPS.
Sorry but IOPS do matter so very much in the business world.
For stand alone drives, your read writes will be what your are looking for.
Wwhat - Wednesday, January 6, 2010 - link
This is all great, finally a company that realizes the current SSD's are too cheap and have too much capacity and that people have too much money.Oh wait..
Wwhat - Wednesday, January 6, 2010 - link
Double post was caused by anadtech saying something had gone wrong, prompting me to retry.Wwhat - Wednesday, January 6, 2010 - link
This is all great, finally a company that realizes the current SSD's are too cheap and have too much capacity and that people have too much money.Oh wait..