Super Talent & TEAM Join the Fast DDR2 Club
by Wesley Fink on October 10, 2006 4:00 AM EST- Posted in
- Memory
Stock Memory Performance
Most Intel processor motherboards provide a wide range of memory ratios that match available DDR2 memory. End-users can select the memory ratio that matches their DDR2 memory speed. For those reasons, we first test all of the stock ratios at the fastest stable timings we can achieve at the given ratio. With ratios, CPU speed remains the same at 2.93GHz in our memory test bed, and memory speed is varied by selecting different ratios.
There are some downsides to this approach. With the memory controller in the chipset, instead of part of the processor as in AM2 systems, there is a small performance penalty for speeds other than a 1:1 ratio (DDR2-533 in this case). However the penalty is in reality very small and memory scales nicely through the various speed options. DDR2 memory is then pushed from the highest stock ratio that could be achieved in testing - in this case 1067 - to the highest FSB speed at the stock multiplier.
Super Talent DDR2-1000
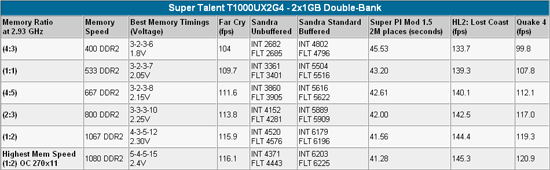
The Super Talent reached a stable speed of 1080, which is below the fastest DDR2 speed we have tested, but still well above the rated specs of DDR2-1000. While the system could boot at speeds as high as DDR2-1100, the Super Talent could not complete our benchmark tests at higher than DDR2-1080.
While the Super Talent reached similar speeds achieved with other top DDR2 memory, a closer look at the performance chart shows the Super Talent generally required a little more voltage and/or a little slower timings for stability at the top and bottom of our memory ratios tests. Where other top DDR2 runs fine at 3-2-2 timings at DDR2-400 and DDR2-533, the Super Talent required 3-2-3 timings. In fact, the memory seemed to be completely averse to running at a 2 setting for RAS-to-CAS at any speed, requiring 3 for that timing. Super Talent also requires a bit more voltage - .05V to .10V more at most speeds - to perform with complete stability. This may mean something as simple as the SPD needs a bit more refinement, or it could reflect different binning procedures compared to Corsair and OCZ.
In the middle range, the important DDR2-800 and DDR2-667, the Super Talent DDR2-100 performed virtually the same as the best we have tested. The message here is that if DDR2-800 is the fastest you will run, the Super Talent performs as well as anything you can buy.
TEAM DDR2-1000
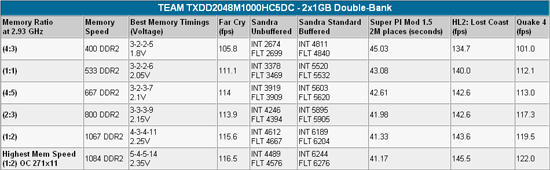
The TEAM performance numbers are so close to our past Corsair and OCZ test results that we can only conclude that the memory chips have to be Micron, which is certainly a good thing. While the TEAM DDR2-1100 topped out at DDR2-1084, the memory matched the best timings we have seen at all the standard test ratios - including DDR2-1067. Required voltages were also similar at each ratio. Together this means that over almost all of the useful range of memory performance the TEAM DDR2-1000 is equivalent to the best DDR2 we have tested at AnandTech.
The TEAM will not reach well over 1100, as the best Corsair and OCZ do, but it performs exactly the same to DDR2-1067 and a bit beyond. If you plan to run the memory in that range then you will be just as happy with TEAM as any DDR2 you can buy and you might save a few dollars on your purchase. However, if your goal is the highest memory speed you can achieve, then you will need to go with the OCZ Alpha VX2 or the Corsair 6400C3.
Most Intel processor motherboards provide a wide range of memory ratios that match available DDR2 memory. End-users can select the memory ratio that matches their DDR2 memory speed. For those reasons, we first test all of the stock ratios at the fastest stable timings we can achieve at the given ratio. With ratios, CPU speed remains the same at 2.93GHz in our memory test bed, and memory speed is varied by selecting different ratios.
There are some downsides to this approach. With the memory controller in the chipset, instead of part of the processor as in AM2 systems, there is a small performance penalty for speeds other than a 1:1 ratio (DDR2-533 in this case). However the penalty is in reality very small and memory scales nicely through the various speed options. DDR2 memory is then pushed from the highest stock ratio that could be achieved in testing - in this case 1067 - to the highest FSB speed at the stock multiplier.
Super Talent DDR2-1000
 |
| Click to enlarge |
The Super Talent reached a stable speed of 1080, which is below the fastest DDR2 speed we have tested, but still well above the rated specs of DDR2-1000. While the system could boot at speeds as high as DDR2-1100, the Super Talent could not complete our benchmark tests at higher than DDR2-1080.
While the Super Talent reached similar speeds achieved with other top DDR2 memory, a closer look at the performance chart shows the Super Talent generally required a little more voltage and/or a little slower timings for stability at the top and bottom of our memory ratios tests. Where other top DDR2 runs fine at 3-2-2 timings at DDR2-400 and DDR2-533, the Super Talent required 3-2-3 timings. In fact, the memory seemed to be completely averse to running at a 2 setting for RAS-to-CAS at any speed, requiring 3 for that timing. Super Talent also requires a bit more voltage - .05V to .10V more at most speeds - to perform with complete stability. This may mean something as simple as the SPD needs a bit more refinement, or it could reflect different binning procedures compared to Corsair and OCZ.
In the middle range, the important DDR2-800 and DDR2-667, the Super Talent DDR2-100 performed virtually the same as the best we have tested. The message here is that if DDR2-800 is the fastest you will run, the Super Talent performs as well as anything you can buy.
TEAM DDR2-1000
 |
| Click to enlarge |
The TEAM performance numbers are so close to our past Corsair and OCZ test results that we can only conclude that the memory chips have to be Micron, which is certainly a good thing. While the TEAM DDR2-1100 topped out at DDR2-1084, the memory matched the best timings we have seen at all the standard test ratios - including DDR2-1067. Required voltages were also similar at each ratio. Together this means that over almost all of the useful range of memory performance the TEAM DDR2-1000 is equivalent to the best DDR2 we have tested at AnandTech.
The TEAM will not reach well over 1100, as the best Corsair and OCZ do, but it performs exactly the same to DDR2-1067 and a bit beyond. If you plan to run the memory in that range then you will be just as happy with TEAM as any DDR2 you can buy and you might save a few dollars on your purchase. However, if your goal is the highest memory speed you can achieve, then you will need to go with the OCZ Alpha VX2 or the Corsair 6400C3.


16 Comments
View All Comments
PeteRoy - Tuesday, October 10, 2006 - link
Anandtech you should really stop using these graphs, their a pain to read.Wesley Fink - Tuesday, October 10, 2006 - link
Would you prefer the bar graphs like we used in past memory reviews? If so, let us know.imaheadcase - Tuesday, October 10, 2006 - link
Yes stop using these graphs. Whats the point of putting squiqly lines on a graph if the performance is pretty close to equal on memory tests you can't notice a diffrence visually? It would be diffrence if your comparing perfomance based on early computers to the latest computer..you could see a change.Stick to the bars plus numbers graphs please.
Frumious1 - Tuesday, October 10, 2006 - link
You people are friggin morons! "Oh noes! We can't read the graph! Please make a goddamn huge ass page with EIGHTEEN graphs instead of three useful charts!" They even give you the numbers at the bottom - is it THAT HARD!?!? Well, for you two, probably, but PLEASE AnandTech, stick with charts like this where it makes sense.Allow me to demonstrate how much less desirable separating the data would be, by using as an example Half-Life 2: Lost Cost. Here you go, all 6 settings put into in-duh-vidual charts:
http://i115.photobucket.com/albums/n284/frumious1/...">DDR2-400
http://i115.photobucket.com/albums/n284/frumious1/...">DDR2-533
http://i115.photobucket.com/albums/n284/frumious1/...">DDR2-667
http://i115.photobucket.com/albums/n284/frumious1/...">DDR2-800
http://i115.photobucket.com/albums/n284/frumious1/...">DDR2-1067
http://i115.photobucket.com/albums/n284/frumious1/...">Maximum Performance (OC)
Isn't that GREAT!? I mean, now we can't easily see how performance is affected going from DDR2-400 to 533 to 667, etc. If you want to whine about non-zero-based charts, whatever. Mine are zero-based, and as you can see there's not a whole hell of a lot of difference past DDR2-800. In fact, there's not much of a difference from DDR2-400 through maximum OC performance... 8.8% more performance from minimum (Super Talent DDR2-400) to maximum (OCZ/Team Highest). Great!
Know what? ALL OF THAT DATA WAS ALREADY CLEARLY VISIBLE IN ONE CHART!
Please, go back to junior high and retake some of those math classes, because clearly they didn't stick.
theprodigalrebel - Tuesday, October 10, 2006 - link
I see nothing wrong with the graphs in this article. For instance, I see a green line (TEAM) stand out at DDR2-667 for the first two tests & stand out again at DDR2-533 in Q4. It is more or less tied with the others. This is useful information. I don't care about 1-3% differences (which could very well be nominal variance) - that means, just buy whatever is cheaper.Why would I need bar graphs that detail performance variances as tiny as .16 frames per second?
imaheadcase - Tuesday, October 10, 2006 - link
Most people would rather glance and pure numbers than any graphs. You would take LESS space than what they use now.Shortass - Tuesday, October 10, 2006 - link
Well the graphs are certainly a little harder to read than large bar graphs, but I enjoy them more since it compresses a lot of information into a smaller space and you can see on one graph the entire set of tests (easier comparison and taking a few extra seconds to read the data is much better than scrolling down a massive page trying to remember the numbers each scored at different speeds, etc).Guuts - Tuesday, October 10, 2006 - link
It would be nice if you could include some "value" RAM in with these performance RAM reviews for comparison. Instead of just talking about how you need to use fairly decent timings if you want to run the modules at 1067 to see a performance advantage, why don't you add in some actual value DDR2-800 RAM that maybe can only run 5-5-5 @ 1067 and 4-3-4 @ 800 (or whatever they can do these days) so we can see just how much performance we're going to lose if we want to save 100$ on RAM? Just how much performance is lost by having looser timings at the same speed?I love performance parts, and want the best components I can afford, but I can't justify paying 50% more for a 5% increase in performance (or +5 FPS) that I'm never going to even be able to notice in real-world use. Note that I said that *I'M* not going to notice, before you start flaming me...
Good article though!
deathwalker - Tuesday, October 10, 2006 - link
Careful guy...there are flaming hound-dogs just lurking around out there waiting for value minded people like you and I. But in defense of the article it was not created with the intent to satisfy that niche. Check out this AT article for some value ram suggestions..http://www.anandtech.com/mb/showdoc.aspx?i=2797">http://www.anandtech.com/mb/showdoc.aspx?i=2797Guuts - Tuesday, October 10, 2006 - link
Yes, thanks, I've read that one... increasing the voltage and loosening tbe timings on DDR2-667 is a little TOO value. I was basically asking what one could do with some value DDR2-800 running at 1067 and how much of a performance hit would be incurred by the loose timings you'd have to use, or even the performance of value DDR2-800 with 4-4-4 timings.Sure that article shows what you could do with that Value RAM as far as pushing the speed and tweaking the timings, but I don't see any performance numbers, nor any comparisons between different timings at the same speeds...which seems pretty important since the price of memory starts to really climb the tighter the timings are at a certain speed. I'd just like to know how much performance one loses between 3-3-3, 4-4-4, and 5-5-5 with DDR2-800, for example, because I sure know how much the price difference is.
I can see the small difference in the TEAM memory vs. the slightly looser timed Super Talent memory, but I can't remember ever reading about the performance differences between more widely varied timings and was curious to see just how much of a hit it makes on the new Core 2 Duo platforms...especially with memory prices what they are today, and 2GB kits seemingly being the recommended "standard" configuration in new systems.